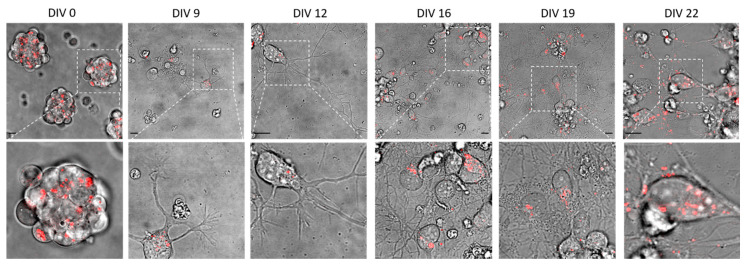
Figure 1.
Microphotographs of living NSCs during differentiation, from DIV0 to DIV22. Bright-field microscopy images (top) with the respective magnification of the area selected by the dashed line (bottom). The bright field images are all superimposed to a confocal fluorescence microscopy image (a section within somas) of lysosomes labeled with LysoTracker Red (in red). Scale bars: 10 μm.

