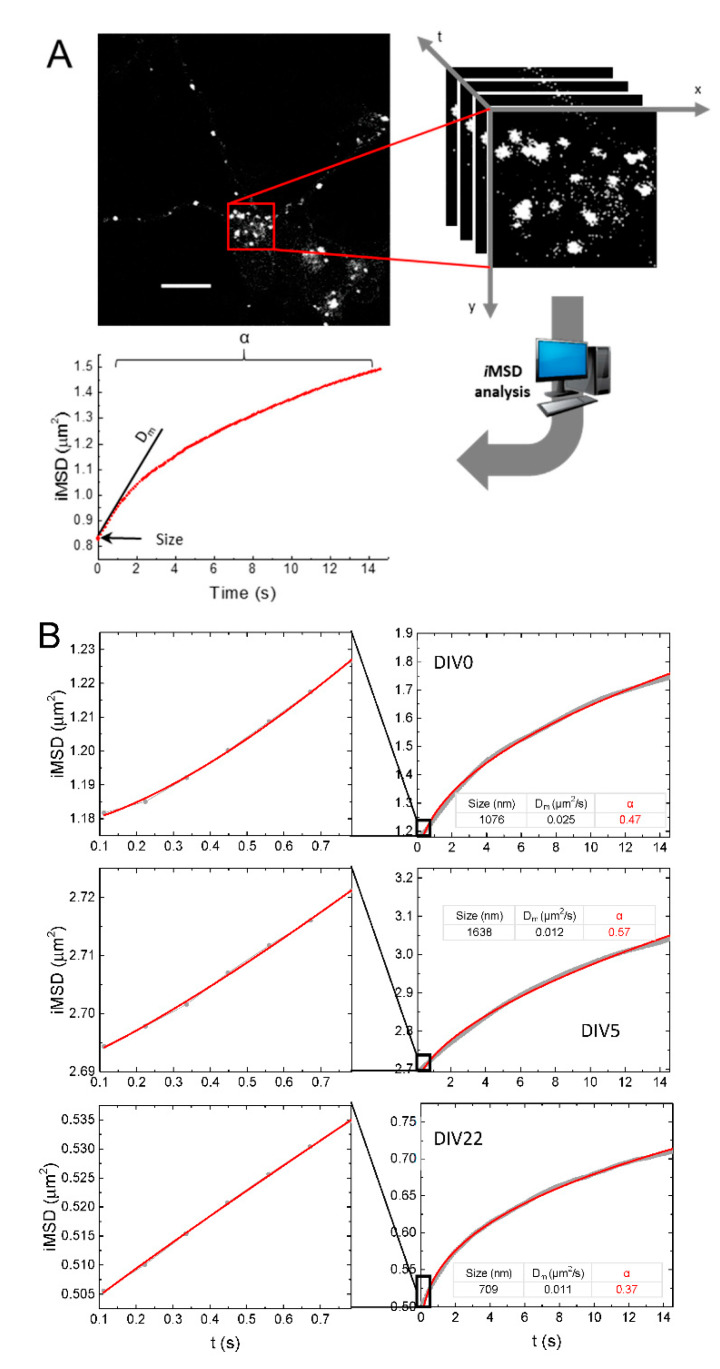
Figure 2.
(A) iMSD analysis workflow. Top left: confocal fluorescence microscopy image of an NSC shows the distribution of lysosomes labeled with LysoTracker Red. Scale bar, 10 µm. Top right: a stack of images from a subregion of the image on the left, acquired with temporal resolution of 112 ms. Scale bar: 10 μm. Bottom: exemplary plot of iMSD (red trace) vs. time of NSC lysosomes populations, with a scheme of how the three output parameters (size, Dm, and α) are determined. (B) Gray dots and lines: exemplary iMSD plots obtained from imaging of living cells stained with LysoTracker at DIV0, 5, and 22. Red: fits with a power law with offset. Right: long temporal scale (14.6 s). Left: short temporal scale (0.8 s).

