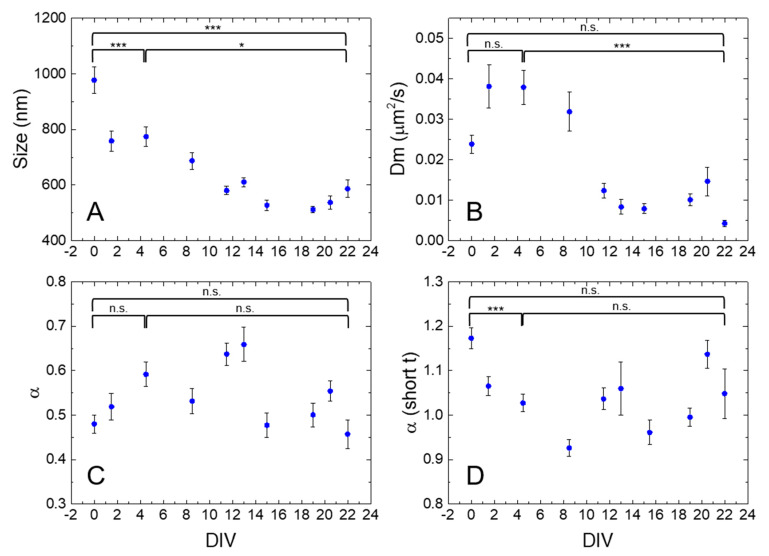
Figure 3.
Plots of average size (A), Dm (B), α (C), and α at short times (D) values extracted from iMSD analysis of NSC lysosome populations acquired during differentiation (DIV0-22). Error bars: Standard Error (SE). The population means of different time points for size, Dm, α, and α (short t) are all significantly different by one-way ANOVA (p < 0.0001). The results of the post hoc Tukey test are shown only for the comparisons amongst DIV0, 4.5, and 22; p-values: n.s. not significant, * <0.05; *** <0.001. Size, Dm, α, and α (short t) average values with the respective DIV, N, and SE are reported in Table S1.

