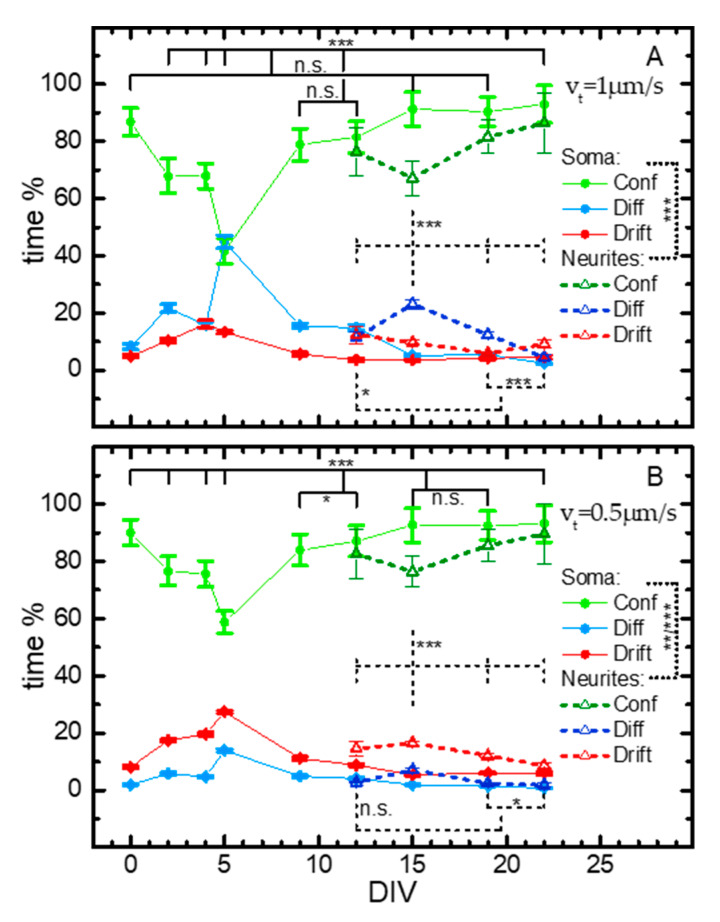
Figure 6.
Dependence on DIV of the distributions (in %) for the time spent by lysosomes in confined (Conf), diffusive (Diff), and drifted (Drift) motion during neural differentiation, within cell bodies (DIV0-22, dots and solid lines) and projections (DIV12-22, triangles and dashed lines). Velocity threshold for drifted subtrajectories in the first analysis step (see text) vt = 1.0 μm/s (A) and 0.5 μm/s (B). The differences at different DIVs were very highly significant (p < 10−20) within each case (soma or projections), according to a test (see Section 4 for tests and uncertainties). Distributions in soma and dendrites were highly significantly different at each considered DIV. (Bonferroni-adjusted) p-values for single comparisons: n.s. >0.05; * <0.05; ** <0.01; *** <0.0015. All the statistical data for these graphs are reported in Table S2

