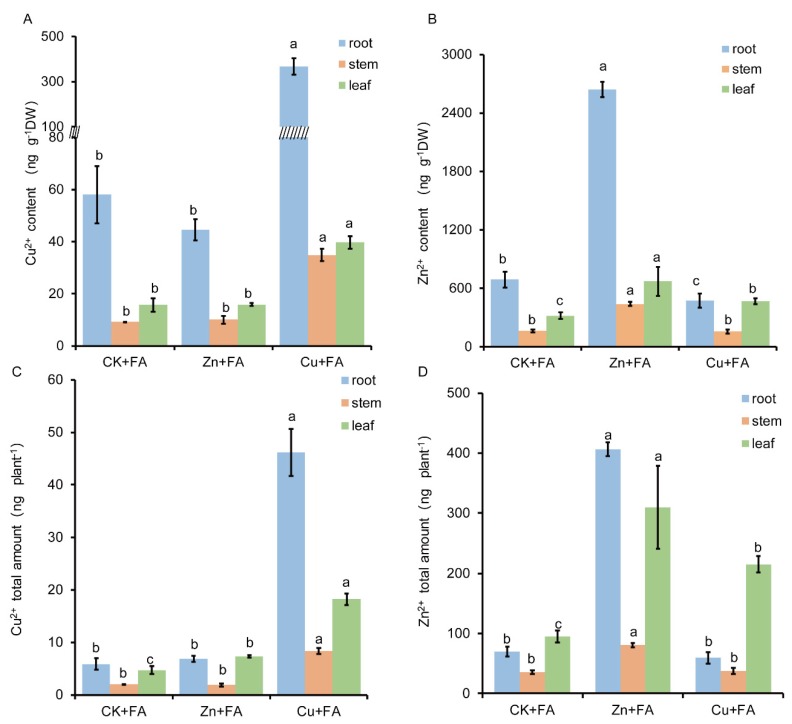
Figure 3.
Relationship between Cu2+ and Zn2+ distribution and the FA distribution. Cu2+ or Zn2+ content (A,B) and amount (C,D) of cucumber plant issues treated with fusaric acid (FA). Bars represent the standard deviation of three replicated each. Different letters indicate significant differences (p < 0.05, Duncan’s multiple range test) of the same tissue among three treatments.

