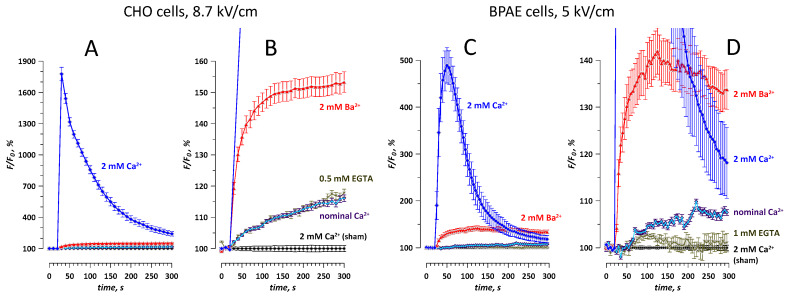
Figure 3.
The effect of the ionic environment on the detection of membrane permeabilization in CHO and BPAE cells (A,B and C,D, respectively). Cells were loaded with Calbryte dye. Images were taken every 10 s (CHO) or every 5 s (BPAE). A single 300-ns pulse at the indicated intensity (kV/cm) was delivered at 27 s. Panels B and D show the same data as A and C, respectively, but on an expanded vertical scale. The labels identify whether the extracellular solution contained 2 mM Ca2+; or 2 mM of Ba2+; or none of them was added deliberately (“nominal Ca2+”); or the free Ca2+ level was further reduced with EGTA (“0.5 mM EGTA” and “1 mM EGTA”). Sham exposures were performed for all ionic conditions, with similar results; shown are the data for sham exposure in 2 mM Ca2+ only. Mean +/ s.e., 10–20 cells per each condition.

