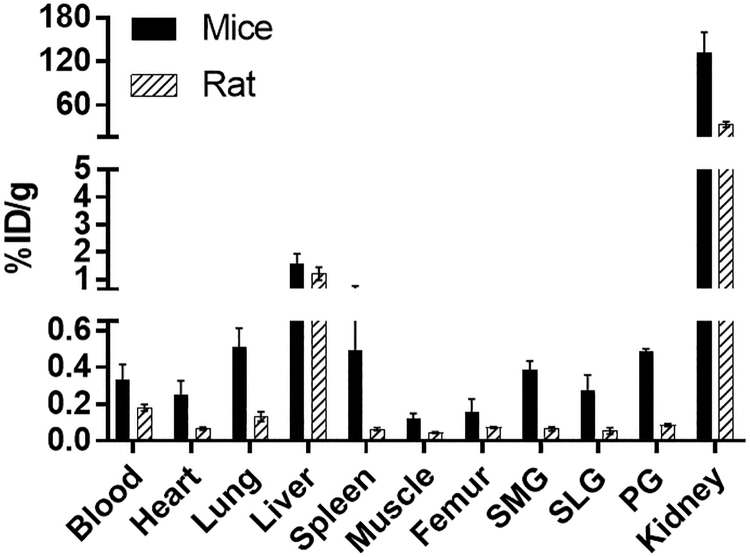
FIG. 4.
Comparison of [18F]DCFPyL biodistribution in rats and mice at 1 h after injection of [18F]DCFPyL. Each bar represents %ID/g ± SD (for mice: %ID/g normalized to 20 g mice; for rats: %ID/g normalized to 125 g rat; n = 5 for each group). SMG, SLG, and PG represent submandibular, sublingual, and parotid glands, respectively.

