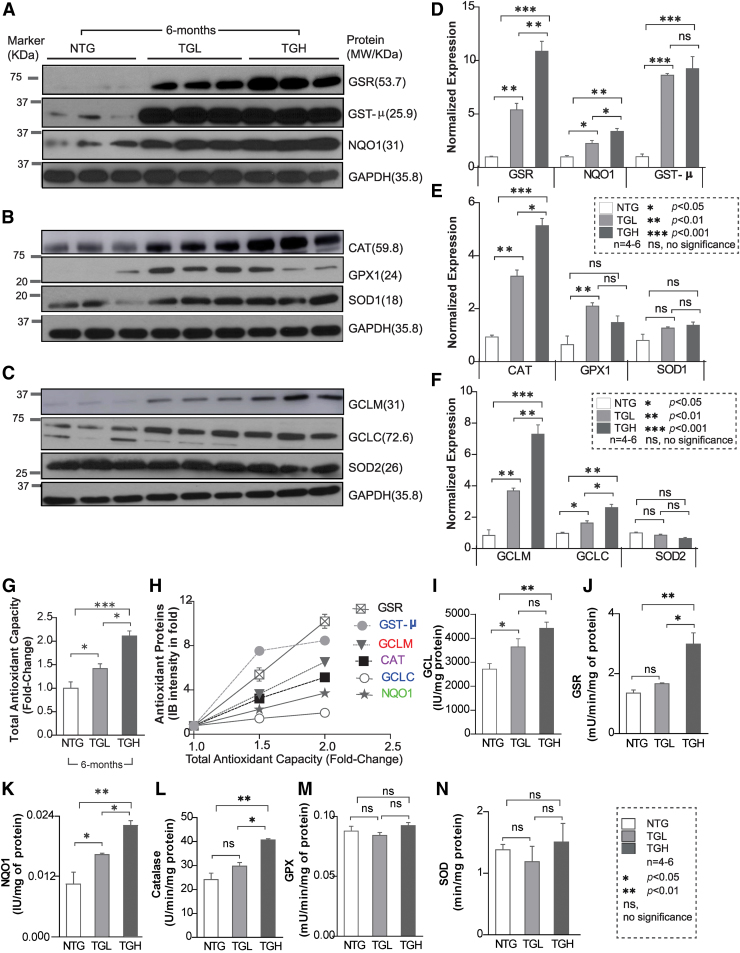
FIG. 3.
Transgenic expression of caNrf2-TG induces proteins and antioxidant activity in mouse myocardium. (A–C) Representative immunoblots (IB) for myocardial antioxidant protein expression in cytosolic extracts from NTG and TG mice at 6–8 months. Each lane indicates an individual mouse. (D–F) Bar graphs illustrate the densitometry analysis performed using NIH ImageJ software of the Western blot data in panels (A–C), respectively. Data are plotted as relative density units of respective proteins after normalization to GAPDH density units. Raw images (uncut) are represented in Supplementary Fig S6. (G) Total antioxidant capacity was measured in NTG and TG mice at 6–8 months of age and represented as fold change (n = 6–8). (H) Analyses between the antioxidant protein abundance and total myocardial antioxidant capacity indicating a direct correlation. (I–N) Major antioxidant enzyme activities in NTG and TG mice at 6–8 months of age (n = 6–8). Data are represented as mean ± SEM. Significance: *p < 0.05; **p < 0.01; ***p < 0.001; ns, no significance. CAT, catalase; GAPDH, glyceraldehyde 3-phosphate dehydrogenase; GCLC, glutamate-cysteine ligase catalytic subunit; GCLM, glutamate-cysteine ligase modifier subunit; GPX1, glutathione peroxidase 1; GSR, glutathione reductase; GST-μ, glutathione-S-transferase Mu (class); NQO1, NAD(P)H:Quinone Oxidoreductase 1; SOD1/SOD2, superoxide dismutase1/2. Color images are available online.

