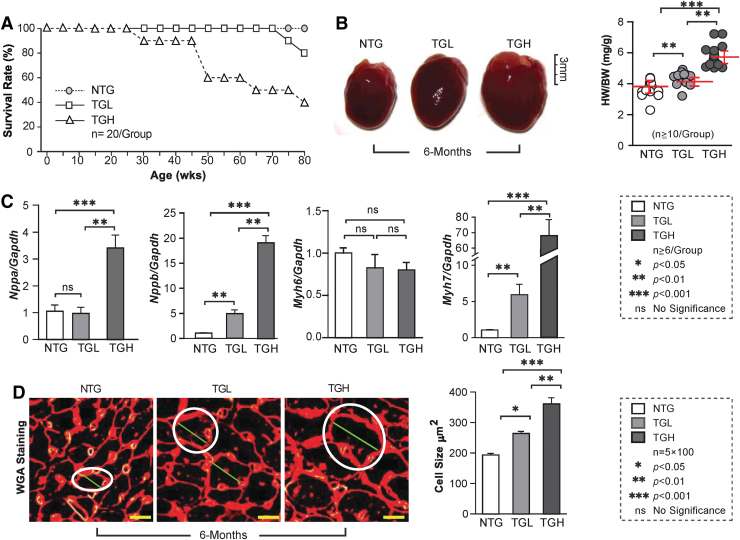
FIG. 4.
cRS causes pathological hypertrophy in TG mouse hearts. (A) RS impact on mouse survival was determined by Kaplan/Meier curves for the 3 mouse groups (n = 20/group). (B) Representative images of hearts are shown for NTG, TGL, and TGH mice at 6 months of age. The heart-to-body weight ratios (HW/BW) were measured for NTG and TG mice at 6 months of age (n = 10/group). (C) The transcript levels of cardiac hypertrophy markers (Nppa, Nppb, Myh6, and Myh7) were measured by qPCR among the three mouse groups (n = 6/group) and normalized against Gapdh. (D) Representative histological images (cross section) of hearts are shown for NTG and TG animals at 6 months of age. Sample sections were stained with WGA. Cardiomyocyte size was determined in at least 100 cells/heart (n = 5 mice/group). The white circles indicate the size of the cells in different mice (genotypes). Data are represented as mean ± SEM. Significance: *p < 0.05; **p < 0.01; ***p < 0.001; ns, no significance. WGA, wheat germ agglutinin. Color images are available online.

