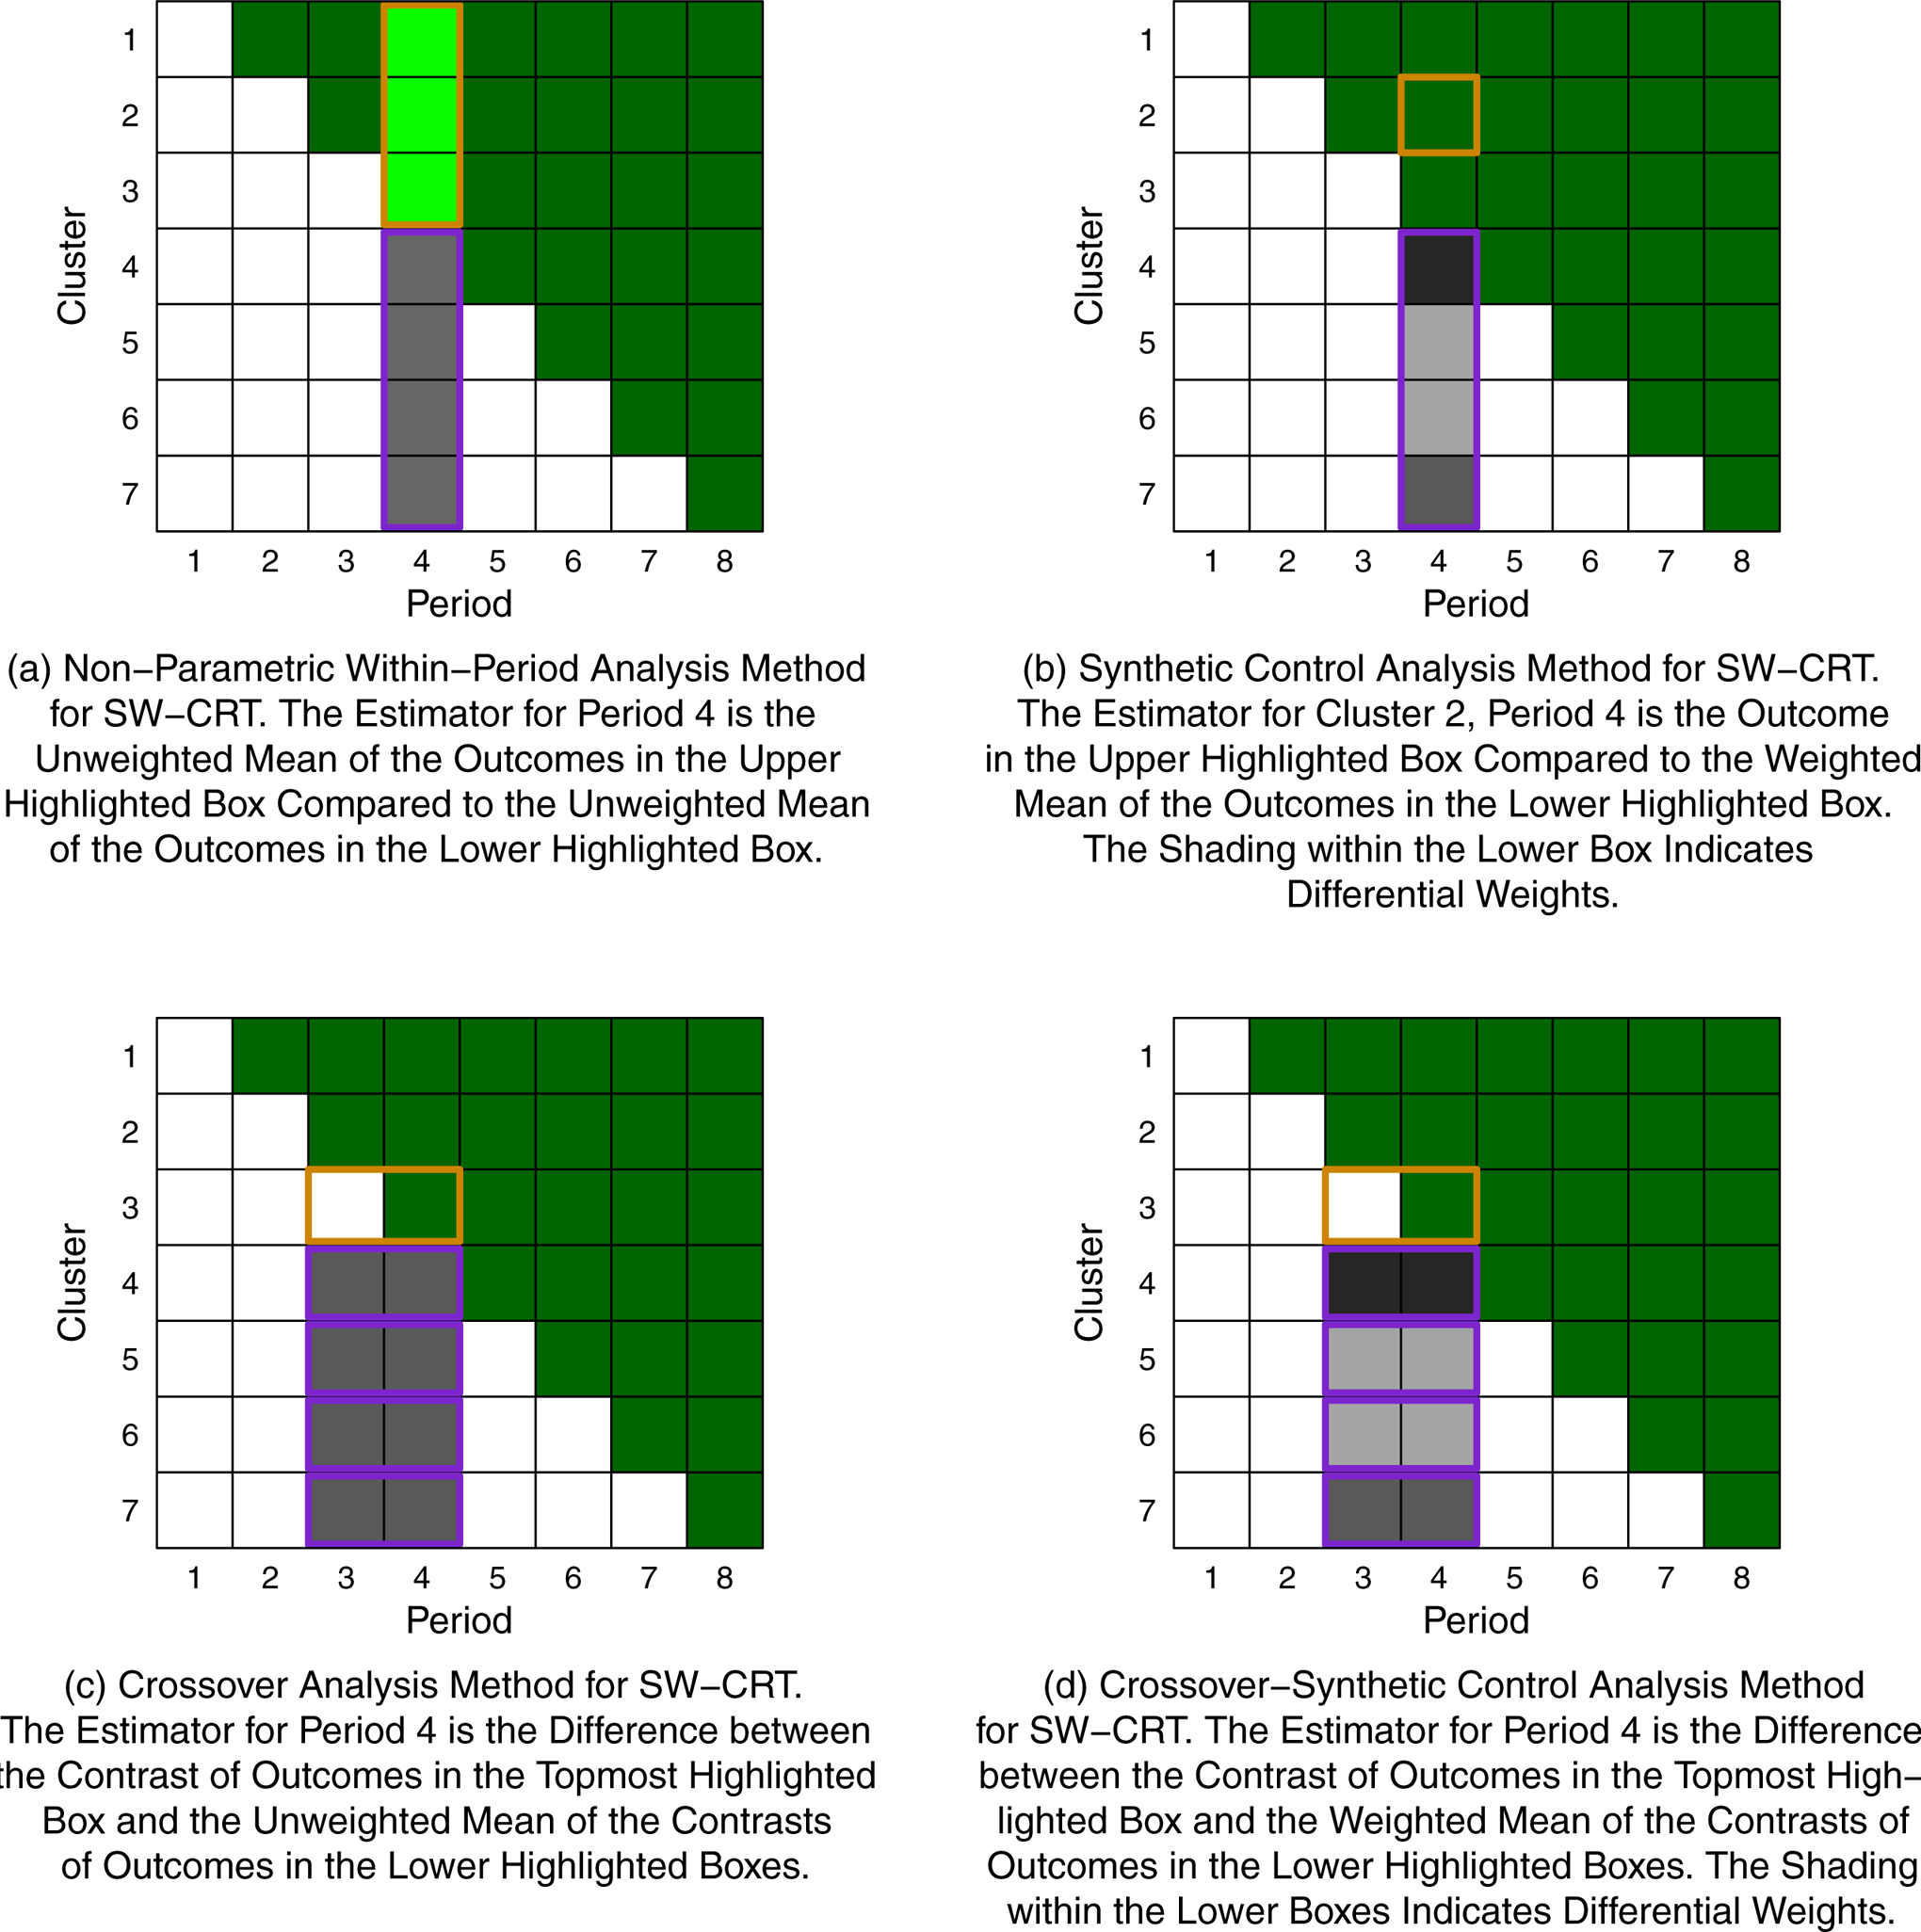
Figure 1.

Schematic Representations of Several Existing and Novel Analysis Methods for a SW-CRT with Seven Clusters, Eight Periods, and One Crossover Per Period. Dark Green Boxes Indicate Cluster-Periods on Intervention and White/Gray Boxes Indicate Cluster-Periods on Control.
