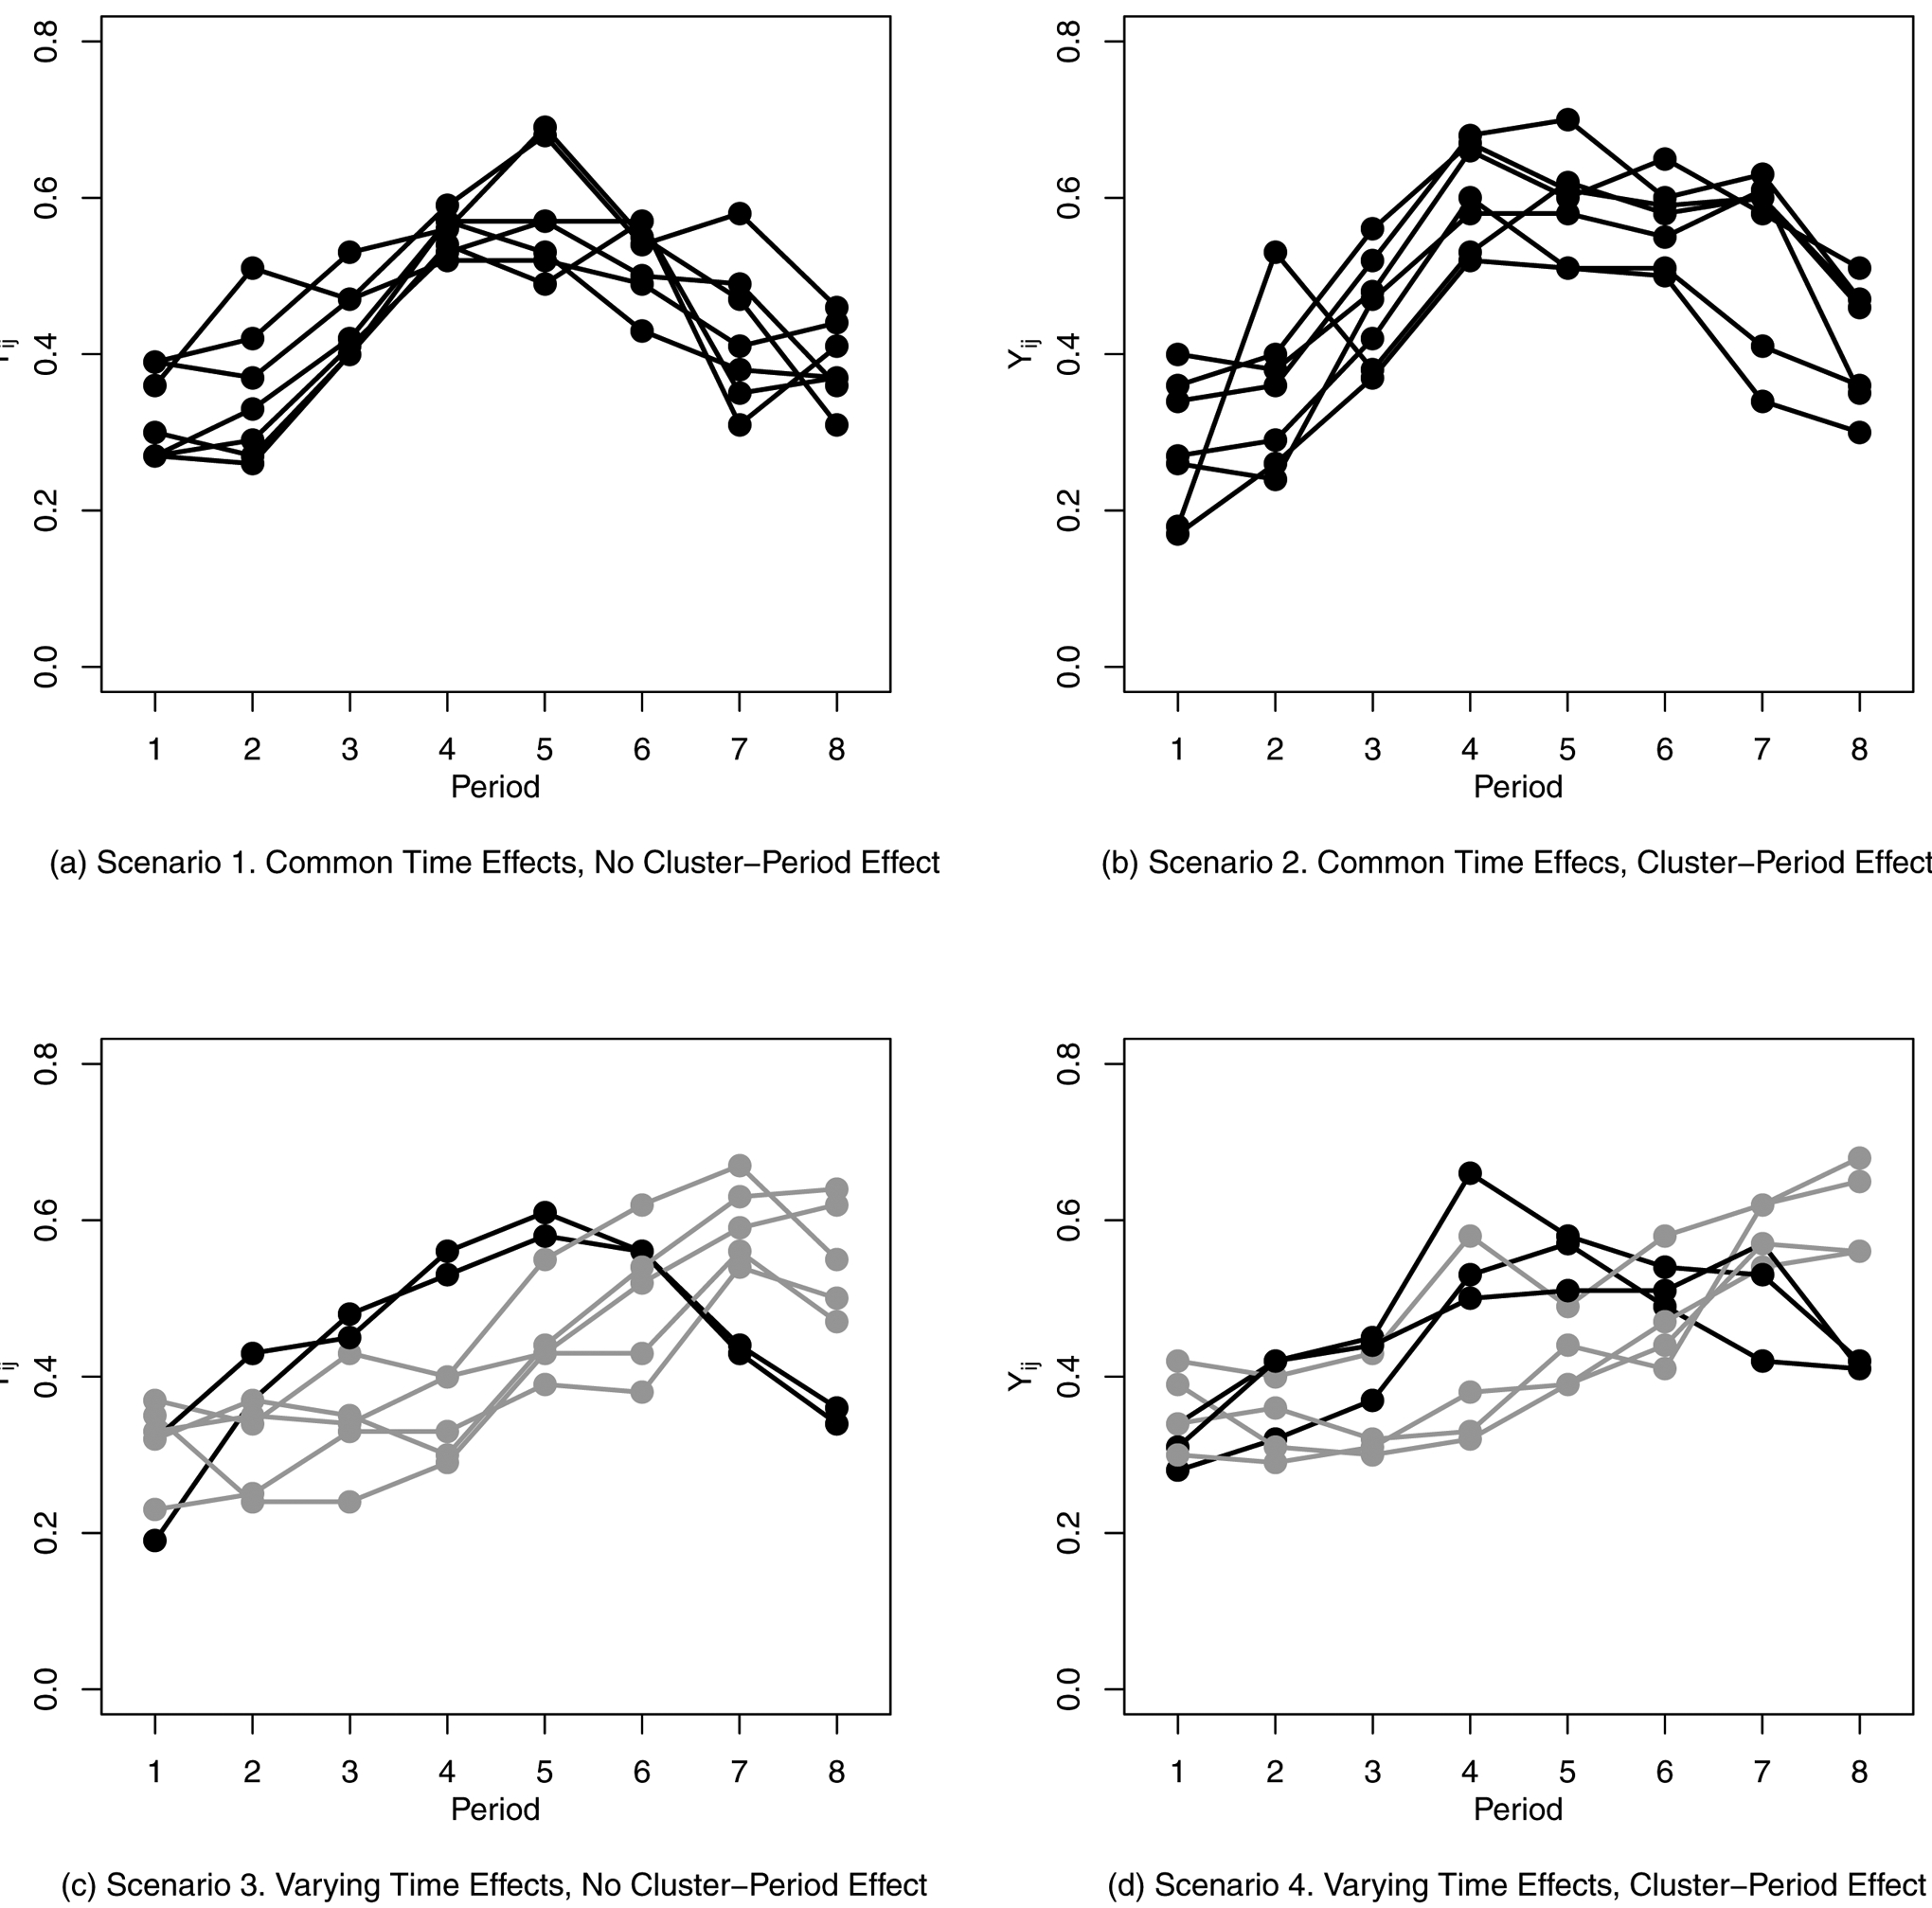
Figure 2.

Sample Generated Data for Four Risk Difference Scenarios (Simulation 1) with No Treatment Effect. Each Line Represents the Simulated Cluster-Level Outcome for One Cluster over Eight Time Periods. Black Lines Represent Clusters with Time Effects θ = θ1 and Gray Lines Represent Clusters with Time Effects θ = θ2.
