Figure 1.
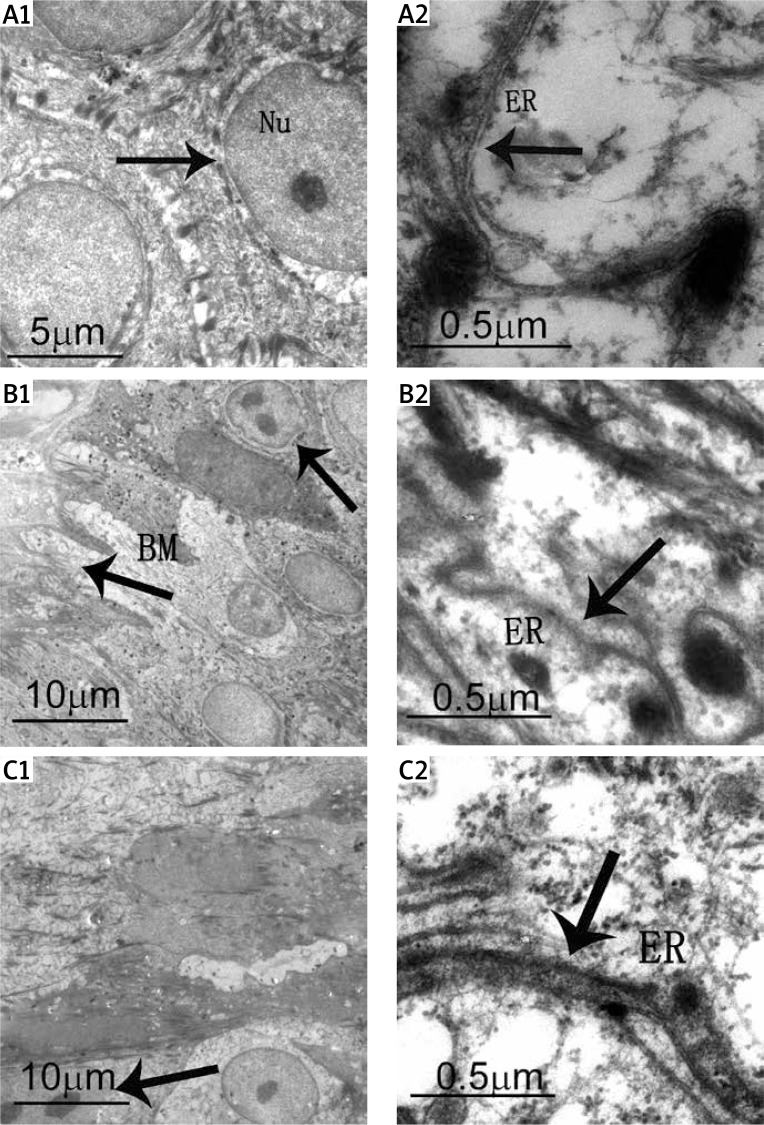
Ultrastructural analysis of ER in PV skin. A1 – Control skin. The arrow demonstrates basal cells connected with spinous layer cells by desmosomes or hemidesmosomes. Nu – nucleus. A2 – Control skin. The arrow demonstrates ER. A large number of free ribosomes are observable in keratinocytes. B1 – Adjacent skin tissue. The arrows demonstrate metabolically active cells and basement membrane (BM). B2 – Adjacent skin tissue. Normal ER are observable in the keratinocytes. C1 – Psoriasis skin tissue. The arrow demonstrates diving cells. C2 – Psoriasis skin tissue. The arrow demonstrates inflated ER

