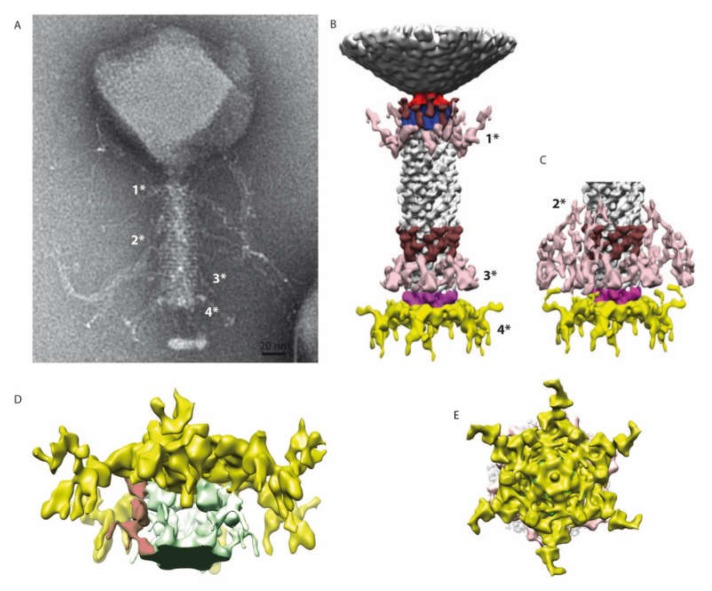
Figure 5.
3D reconstruction of the entire tail. (A) A negative staining image of phAPEC6. The different fibers are labeled 1*, 2*, 3* and 4* (for the baseplate one). (B) 3D reconstruction of the entire tail at a normal threshold (resolution 25 Å). The baseplate plus fiber are colored in yellow and pink; the different fibers anchored in the tail (1*, 2* and 3*) are in light pink; a decoration protein present at 2 levels of the tail is colored in brown and the collar and the portal are colored respectively in blue and red. (C) Distal part of the tail at a high contour level: the fibers located at the 2*-level are visible. The same color code as in B has been used. (D) Detail of the baseplate at a higher contour level. The host membrane patch (green), as well as some fibers connected to the membrane, are visible (red). (E) Bottom view of the baseplate showing the complex organization of this part.

