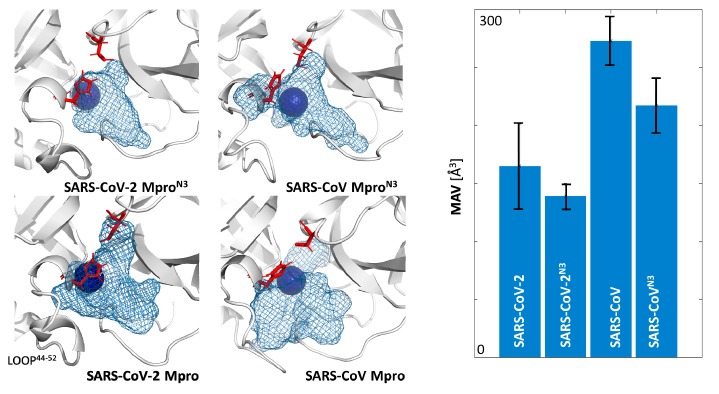
Figure 2.
The differences between the maximal accessible volume of the binding cavities calculated during molecular dynamics (MD) simulations of both apo structures of Mpros (SARS-CoV and SARS-CoV-2) and structures with co-crystallised N3 inhibitor (SARS-CoVN3 and SARS-CoV-2N3) used as different starting points for 10 replicas of 50 ns per structure. The position of the blue sphere (hot-spot with highest density) in each structure reflects the position of the catalytic water molecule.

