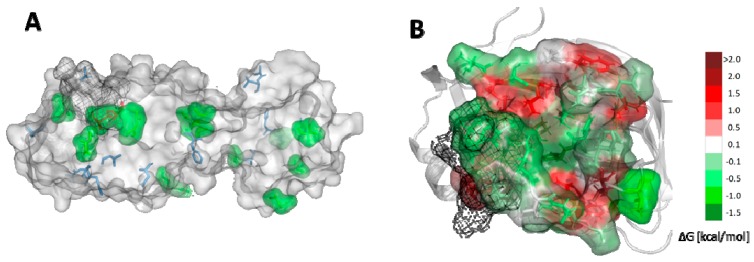
Figure 6.
Potential mutability of SARS-CoV-2 Mpro. (A) Structure of SARS-CoV-2 Mpro with the most energetically favourable potential mutations of amino acids marked as green surface. Positions of amino acids that differ from the ones in SARS-CoV Mpro structure marked as blue sticks. Catalytic dyad marked as red. (B) The catalytic site of SARS-CoV-2 Mpro is shown as surface with the most energetically favourable potential mutations shown as green, neutral as white, and unfavourable as red. The C44-P52 loop is shown as black mesh.

