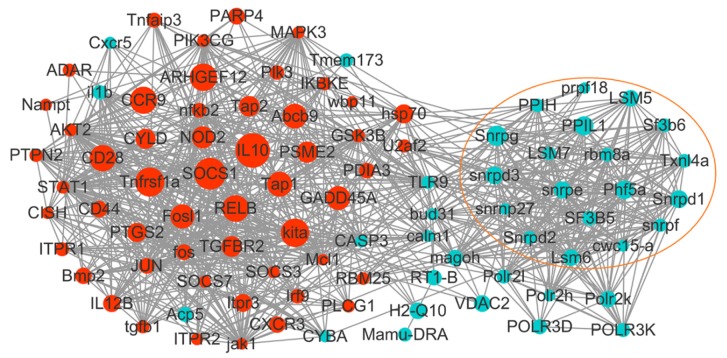
Figure 5.
The interaction network formed by immune related DEGs. The nodes in the network represent DEGs, and the lines connecting different nodes denote interactions between the DEGs. Red and blue nodes represent up- and downregulated DEGs, respectively. Node size indicates the log2|FC| of the DEGs. The DEGs involved in spliceosome and splicing are enclosed in an orange lined circle.

