Fig. 2.
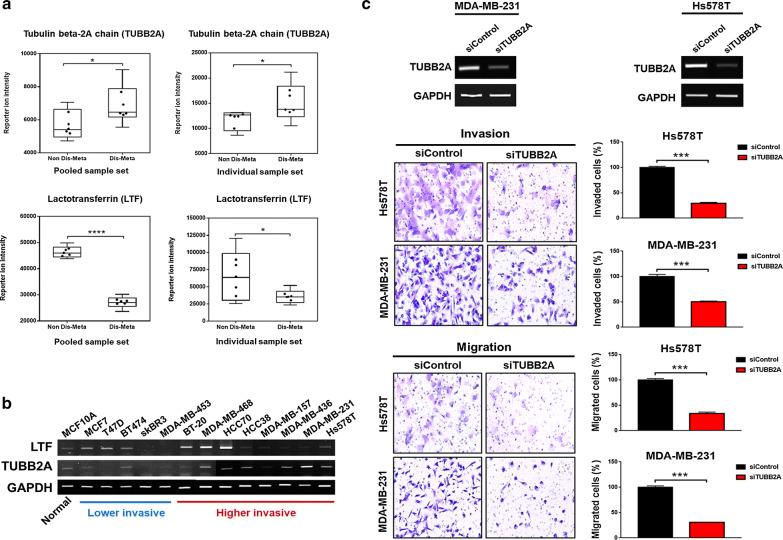
Validation of TUBB2A and LTF as protein targets. a Protein expression patterns of TUBB2A and LTF by mass spectrometry; expression pattern of reporter ion intensity of TUBB2A (upper panel) and LTF (lower panel) in pooled sample set (left panel) and individual sample set (right panel), respectively. The data in the interquartile range are displayed as black dots (* < p-value 0.05; **** < p-value 0.0001).b Expression patterns of TUBB2A and LTF in various breast cancer cell lines by RT PCR. Higher expression levels are lighter than lower levels (red line; higher invasive BC cell lines, blue line; lower invasive BC cell lines). c Results of invasion and migration assays for TUBB2A using Hs578T and MDA-MB-231 BC cell lines. RT-PCR of TUBB2A, downregulated by siRNA transfection in both cell lines (upper panel). Images of invading and migrating cells (lower left panel) and percentage (%) of invading and migrating cells (lower right panel) (*** < p-value 0.001)

