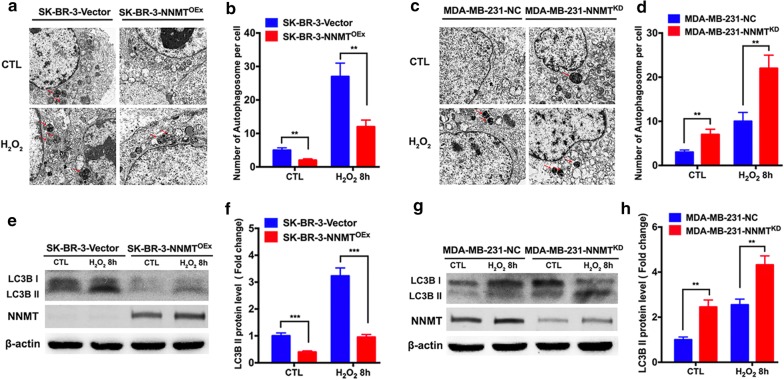
Fig. 2.
NNMT inhibited autophagy induced by H2O2. a, c The autophagosomes in the two cell models after H2O2 treatment were imaged by transmission electron microscopy. A representative result from three independent experiments. b, d The quantification results of (a) and (c), respectively (**p < 0.01 and ***p < 0.001). e, g The LC3B protein level in the two cell models after H2O2 treatment was determined by Western blotting. A representative result from three independent experiments. f, h The quantification results of (e) and (g), respectively. The protein levels were normalized to β-actin (**p < 0.01 and ***p < 0.001)

