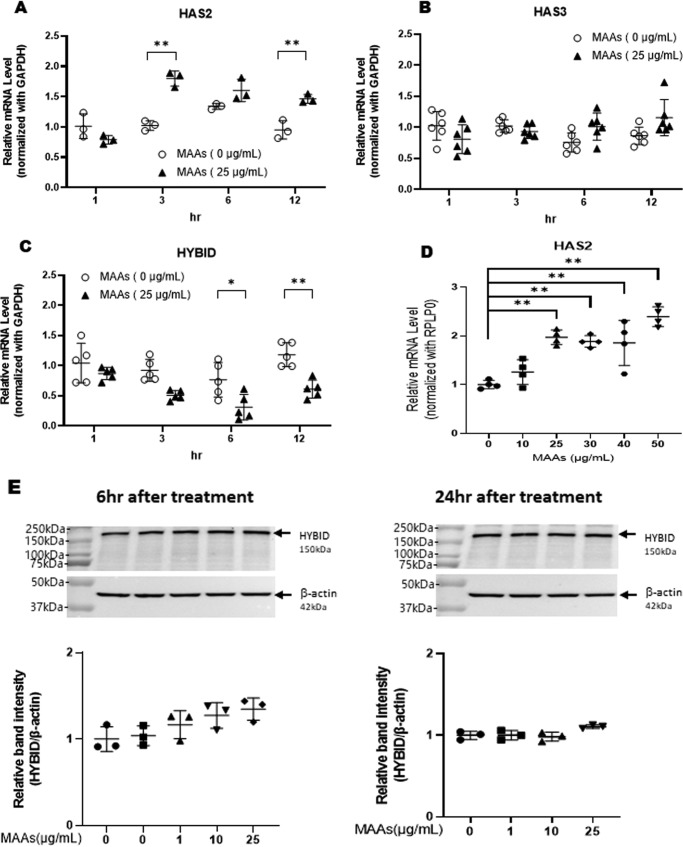
Figure 3.
Effects of MAAs on levels of HAS2 mRNA (A/D), HAS3 mRNA (B), HYBID mRNA (C), and protein (E) in HDFs. HDFs were cultured in the presence or absence of MAAs at 25 μg/ml (A–C) or at 0–50 μg/ml (D and E) for the indicated times (A–C) or 3 h (D) and were then subjected to qRT-PCR analysis for HAS2, HAS3, and HYBID mRNA levels or to Western blotting for HYBID protein levels. Representative immunoblots from three independent experiments are shown (E). Data represent means ± S.D. A: n = 3; B: n = 6; C: n = 5; D: n = 4; E: n = 3; *, p < 0.05; **, p < 0.01 versus the nontreated control (0 μg/ml).

