Figure 1.
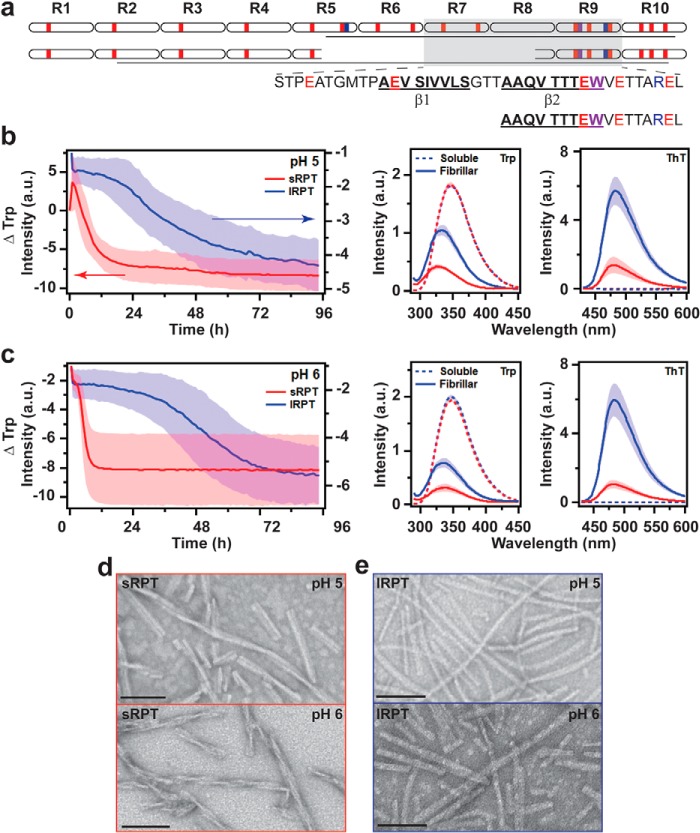
Comparison of sRPT and lRPT fibril formation as a function of pH. a, schematic representation of the primary sequence of lRPT (top) and sRPT (bottom). Acidic, basic, and tryptophan residues are colored in red, blue, and purple, respectively. Lines represent the protease-resistant region defined in this work. Amino acids defining the putative β-strands in lRPT fibrils, as defined previously (16), are also shown. b and c, aggregation kinetics of 30 μm lRPT (blue) and sRPT (red) at pH 5 (b) and 6 (c) under constant linear shaking (3 mm) at 37 °C. Trp and ThT fluorescence were collected of soluble (dashed) and fibrillar (solid) RPT before and after aggregation reactions, respectively. Spectra are normalized for respective concentration. Solid line and shaded area represent the mean and S.D. from three independent experiments, respectively. d and e, representative TEM images of sRPT (d) and lRPT (e) fibrils. Scale bars represent 100 nm.

