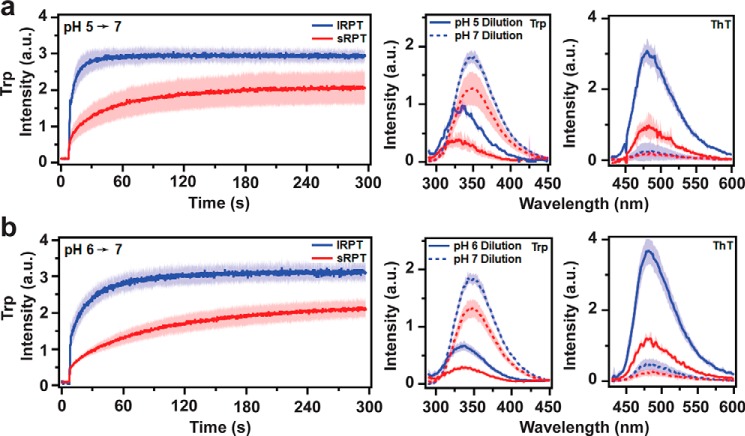
Figure 4.
Comparison of disaggregation of lRPT and sRPT fibrils at pH 7. a and b, lRPT (blue) and sRPT (red) fibrils (10 μm) formed at pH 5 (a), or 6 (b) were diluted 6-fold into pH 7 buffer and Trp emission was monitored under constant stirring at 25 °C. Trp and ThT fluorescence were collected after self-dilution (solid lines) or dilution into pH 7 buffer (dashed lines). Bold line and shaded area represent the mean and S.D. from three independent experiments, respectively.

