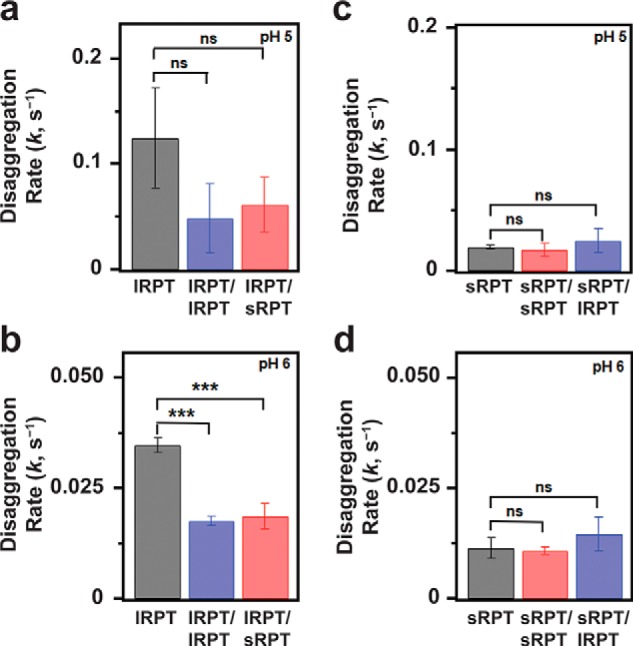
Figure 5.

Disaggregation of self- and cross-seeded RPT fibrils. a–d, disaggregation rate constants, k, extracted from single-exponential fits of kinetic curves shown in Fig. 4 for unseeded lRPT (a and b) or sRPT (c and d) and Fig. S9 for self- and cross-seeded fibrils. p values were calculated from three independent experiments using unpaired t tests (GraphPad), where ns and *** represent p > 0.05 and p ≤ 0.001, respectively.
