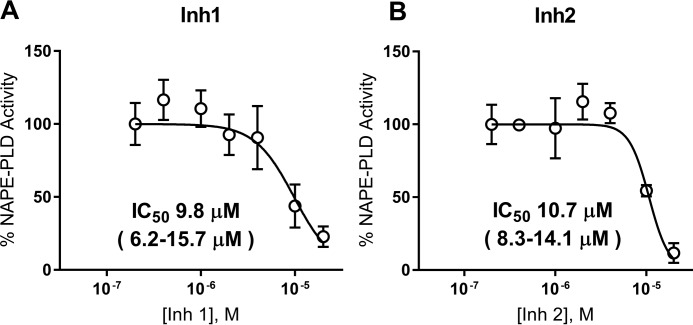
Figure 6.
Inh 1 and Inh 2 inhibit the NAPE-PLD activity of HEK293 cells. 0–20 μm of Inh1 (A) or Inh 2 (B) were added to confluent wells of HEK293 cells plated in 96-well plates and incubated for 30 min. PED-A1 was then added, and NAPE-PLD activity was determined by change in fluorescence (excitation/emission, 488/530 nm) over 25 min and then normalized to control. The points represent means ± S.E. (n = 6, three wells on two replicate days). IC50 and 95% confidence interval calculated using log(inhibitor) versus normalized response–variable slope analysis.

