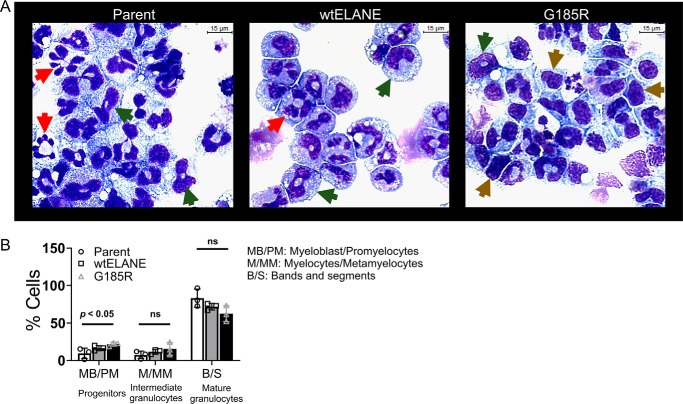
Figure 5.
G185R ELANE impaired morphological differentiation. A, Wright–Giemsa–based morphological analysis of cytospin-immobilized 32D parental cells and ones expressing ELANE (WT and G185R). For quantitation, cells were classified into three different stages of differentiation: brown arrows, myeloblasts/promyelocytes; green arrows, myelocytes/metamyelocytes; red arrows, bands/segmented. B, graphical description of differential cells counts of 32D parental and 32D cells expressing WT ELANE and G185R. Differential counts are shown as bar charts. Data are represented as mean ± S.D. (n = 3). Statistical significance was computed using Student's t test (ns, nonsignificant).

