
Figure 1. DDX6 depletion endows hPSCs with a differentiation-resistant, “hyper-pluripotent” state.
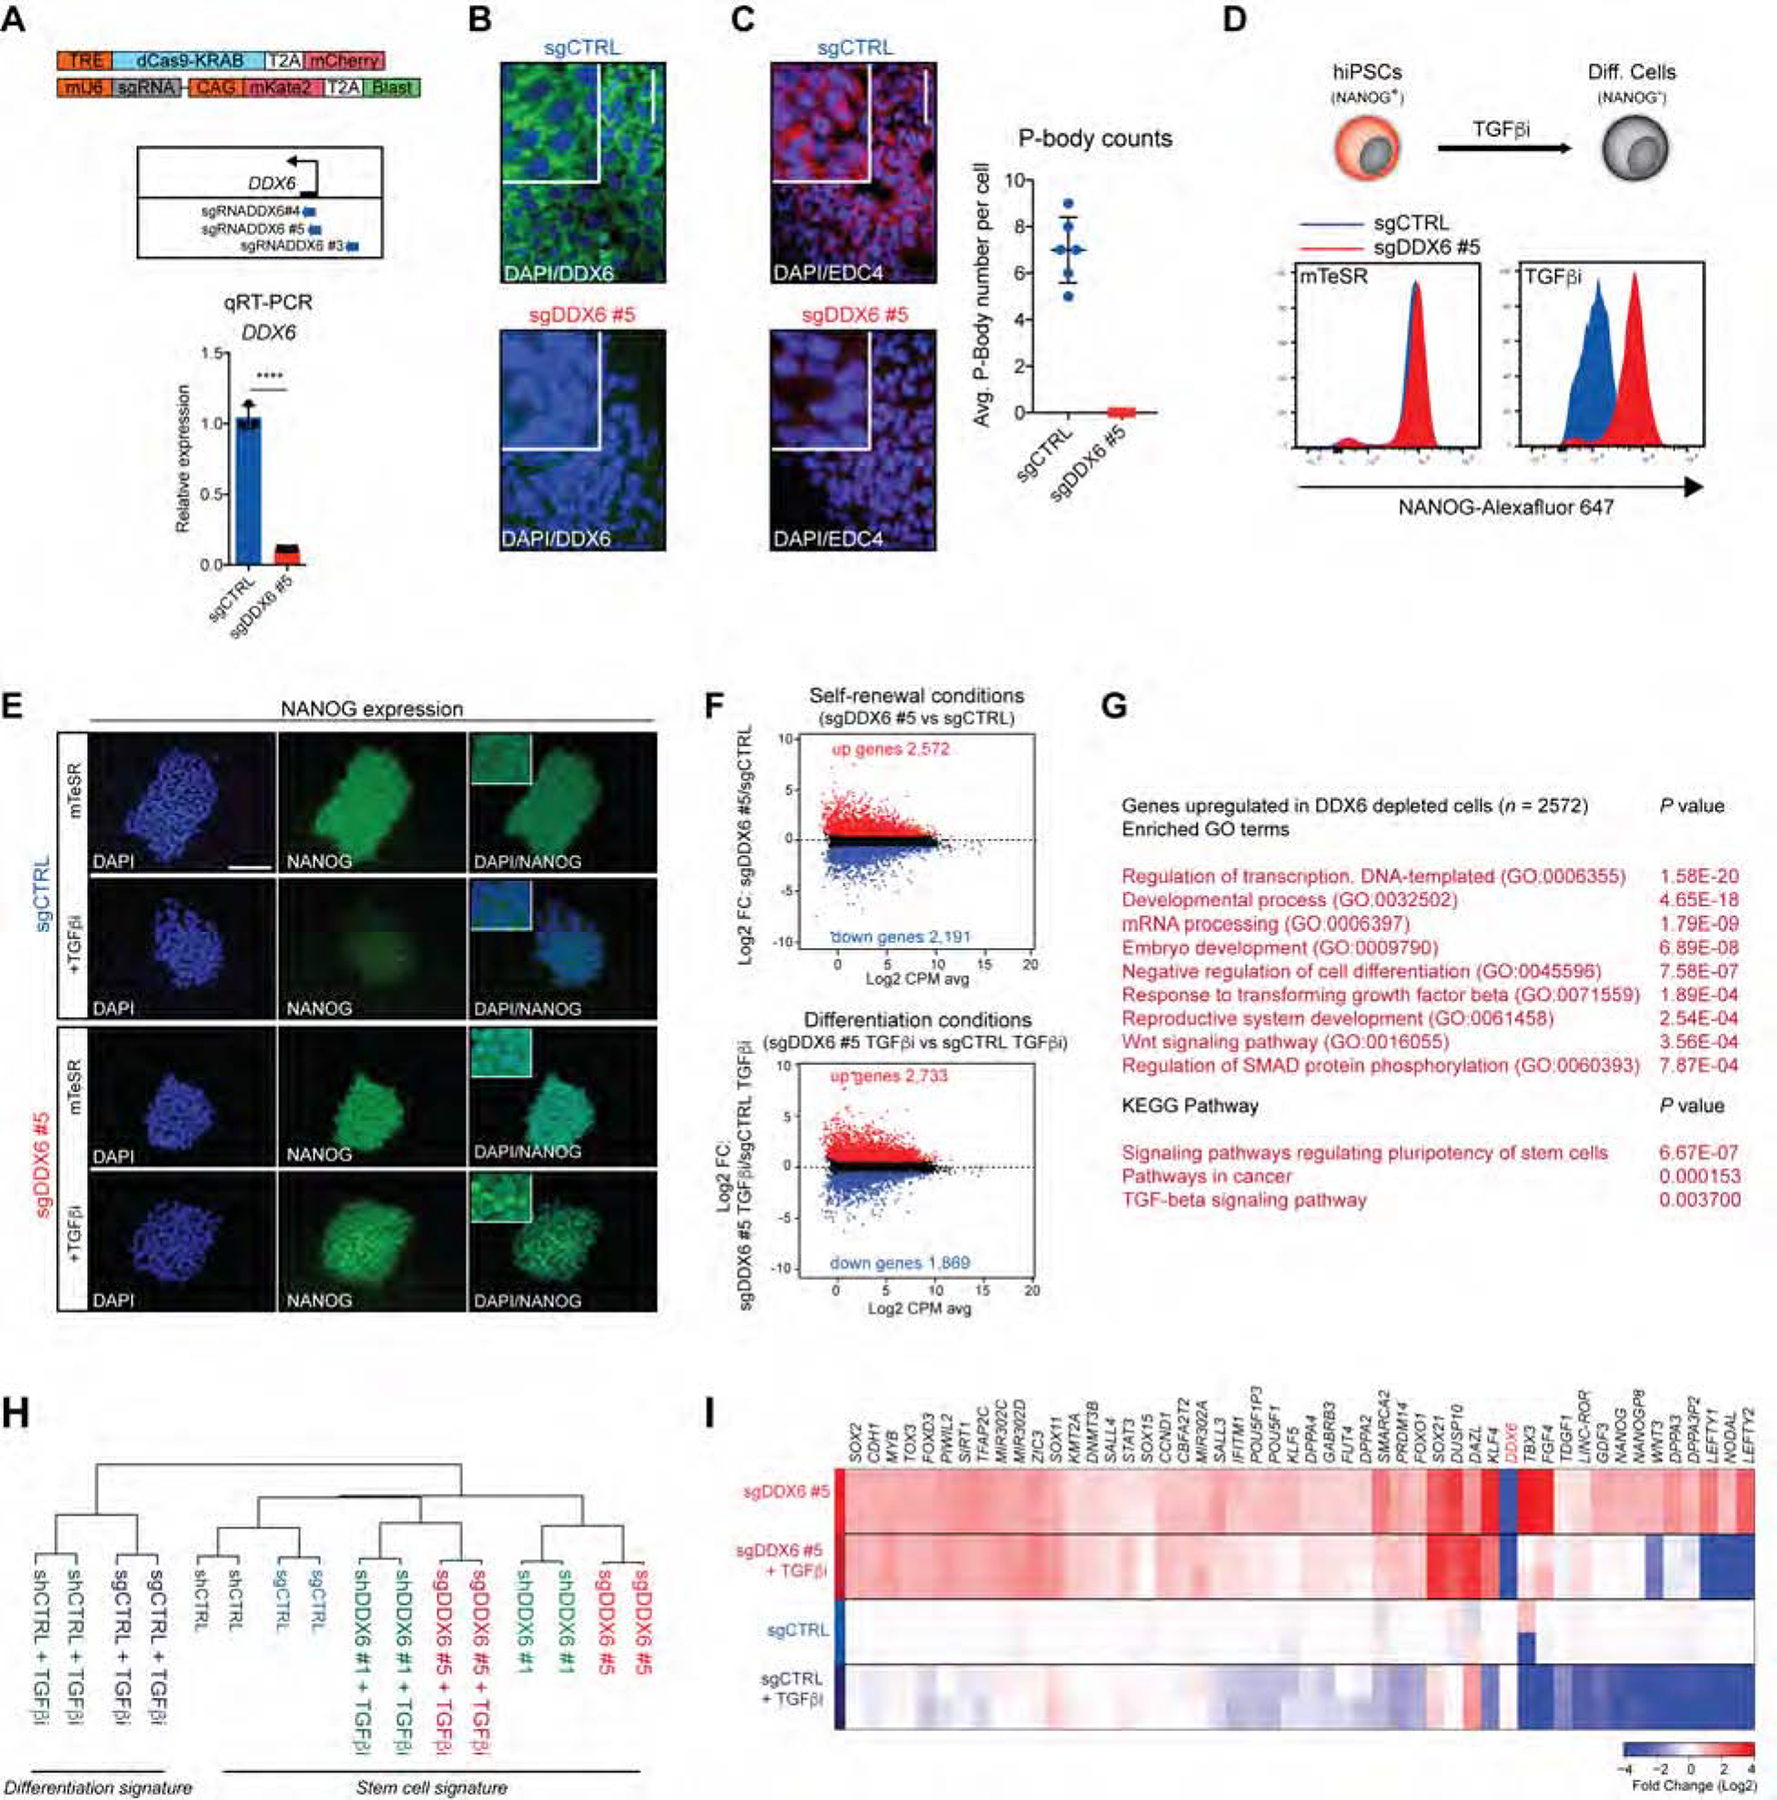
(A) Schematic of dCas9-KRAB and sgRNA vectors and genomic positions of the sgRNA targeting the DDX6 TSS (upper panel). QRT-PCR analysis of DDX6 in sgCTRL and sgDDX6 #5 cells treated with dox. Unpaired Student’s t test. n=3, mean ± s.d., ****P<0.0001. (B) Immunofluorescence image showing protein expression of DDX6 (scale: 50 μm; inset 2X). (C) Immunofluorescence image showing protein expression of EDC4 (scale: 50 μm; inset 2X) (left panel). P-body count per cell (right panel), n=6, mean ± s.d. (D) Schematic of hiPSCs differentiation (upper panel). FACS analysis of the proportion of NANOG+ cells (lower panel). (E) Immunofluorescence images showing protein expression of NANOG (scale: 100μm). (F) MA plots of RNA-seq data depicting upregulated genes in red and downregulated genes in blue (FC>1.5; FDR<0.01). (G) GO and KEGG pathways analysis of upregulated genes (FC>1.5; FDR<0.01) in sgDDX6 #5 vs sgCTRL cells. (H) Hierarchical clustering of RNA-seq samples. (I) Heatmap showing expression levels of selected pluripotency genes (n=2 each condition).
See also Figures S1, S2 and S3.