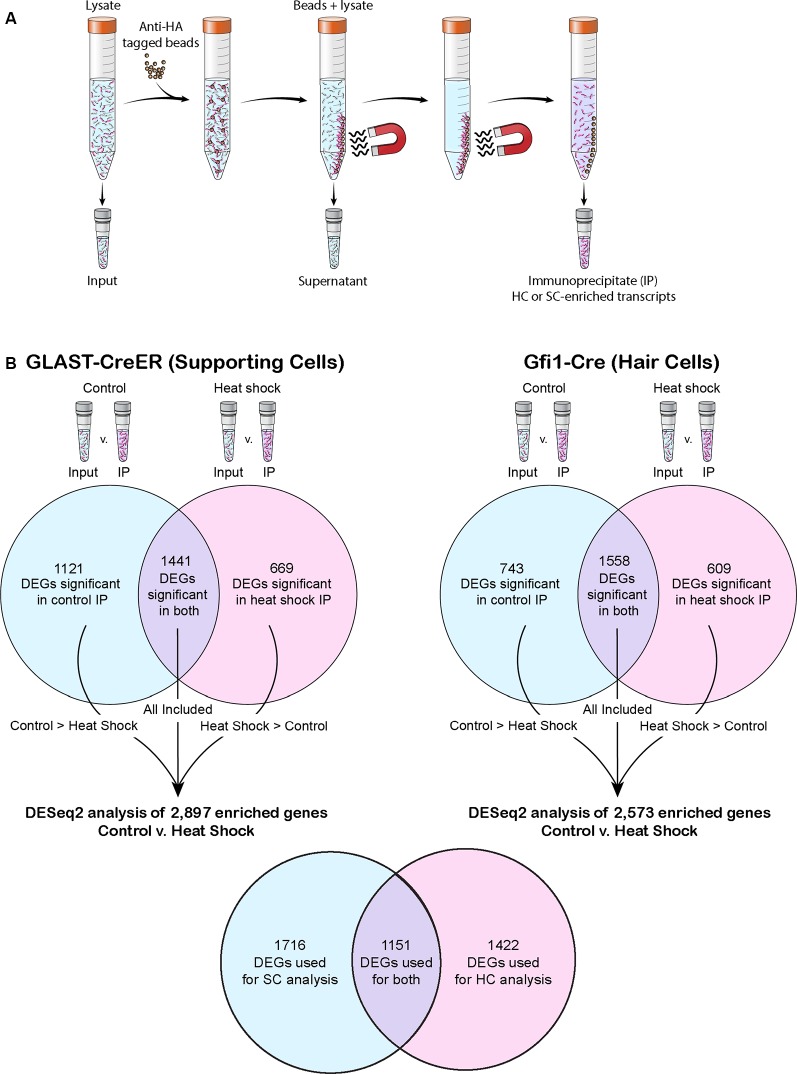
Figure 1.
The RiboTag precipitation method and post-RiboTag gene comparison performed in this study. (A) The RiboTag precipitation method uses anti-hemagglutinin (HA) tagged beads to select for HA-tagged ribosomes. Because only ribosomes of the cell type selected for by the Cre driver are HA-tagged, the resulting immunoprecipitate (IP) contains cell type-specific transcripts. (B) Transcripts of each experiment’s IP were compared to transcripts of the corresponding input in order to computationally remove any background (non-cell specific transcripts) not successfully removed as part of the supernatant. When comparing across conditions or drivers, only genes found to be significant in the IP of both conditions or significant in the IP of the condition in which that transcript had greater mean expression were included in the analysis. Venn diagrams depict the number of differentially expressed genes (DEGs) that reached significance in one or both conditions of control and heat shock for each Cre driver. The total number of genes used in each control vs. heat shock DESeq2 analysis is listed, and the number of genes these analyses had in common is shown in the final Venn diagram.

