
Figure 2.
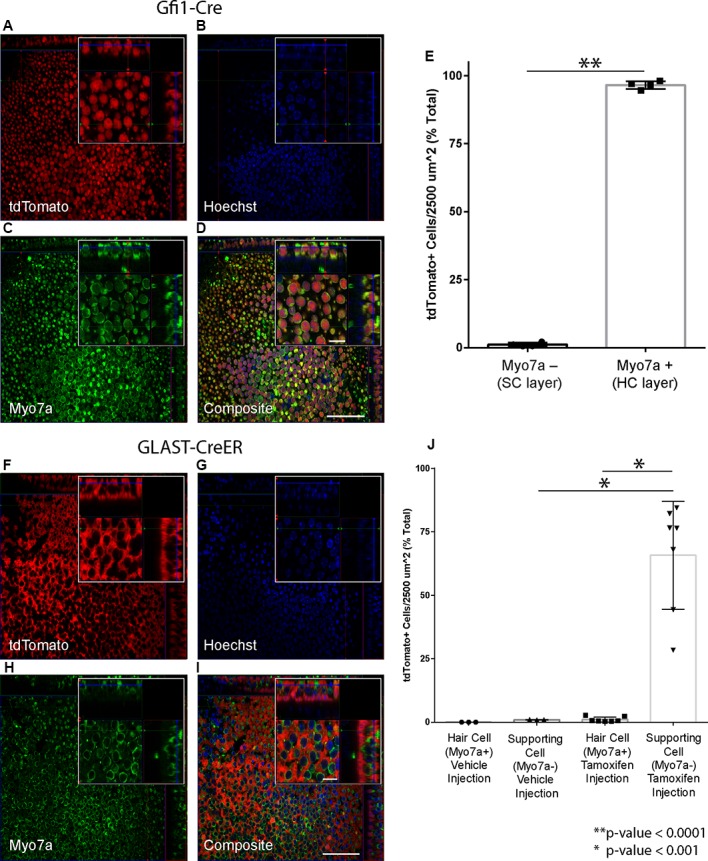
Hair cell (HC) and supporting cell (SC)-specific recombination using the Cre drivers selected for the study. (A–E) Gfi1-Cre results in recombination in HCs. (A–D) Representative maximum intensity projections from a Gfi1-Cre x Rosa26-tdTomato mouse utricle showing tdTomato expression (A). Myo7a (C) was used as a hair cell marker to count HCs, and Hoechst staining (B) was used to count SC nuclei. Composite image (D) shows localization of the tdTomato signal primarily in HCs. (E) 96.5% of HCs and 1.1% of SCs are tdTomato+ in utricles from Gfi1-Cre;Rosa26-tdTomato mice. (F–I) GLAST-CreER results in recombination in SCs. Representative maximum intensity projections from a tamoxifen-injected GLAST-CreER;Rosa26-tdTomato mouse showing tdTomato expression (F), Myo7a (hair cell marker) staining (H), Hoechst (G), and a composite (I) immunostaining. Localization in SCs is observed in the composite image. (J) Quantification of tdTomato expression in cells in both vehicle-injected and tamoxifen-injected mice showing that tamoxifen results in tdTomato induction in SCs with little induction in HCs. Scale bars (I) represent 50 μm (large panel) and 10 μm (small panel) and apply to all panels of the same respective size.