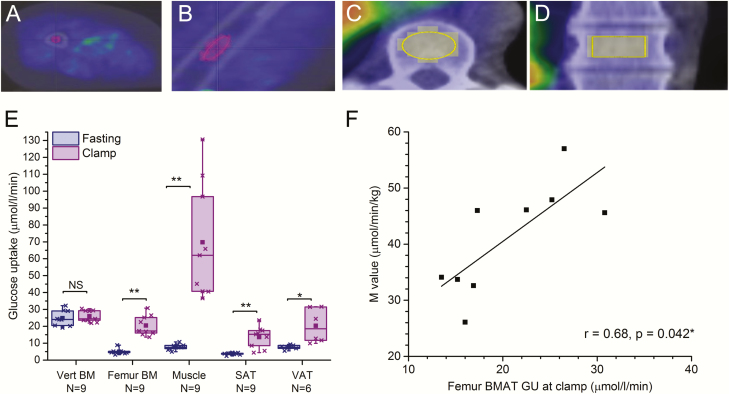
Figure 1.
Insulin enhances GU in human femoral BMAT. Glucose uptake (µmol/l/min) in vertebral and femoral BM in healthy control subjects (n = 9). Volume of interest (VOI) in femoral bone marrow in cross-sectional image (A) and sagittal image (B); and in vertebral bone marrow in cross-sectional image (C) and sagittal image (D). E: Regional GU (µmol/l/min) in lumbar vertebral bone marrow (Vert BM, n = 9), femoral bone marrow (Femur BM, n = 9), skeletal muscle (Muscle, n = 9), abdominal subcutaneous adipose tissue (SAT, n = 9), and visceral adipose tissue (VAT, n = 6) during fasting state and hyperinsulinemic euglycemic clamp. P-values for clamp-induced change are given as: *P < 0.05, **P < 0.01, ***P < 0.001, NS not significant P > 0.05. The lines of the boxes represent the 25th, 50th, and 75th percentiles, whiskers 10th and 90th percentiles, and the square indicates the mean value. F: Correlation between femur BMAT GU (µmol/l/min) and M-value (µmol/min/kg) (N = 9). Values are mean + SEM.

