Figure 2.
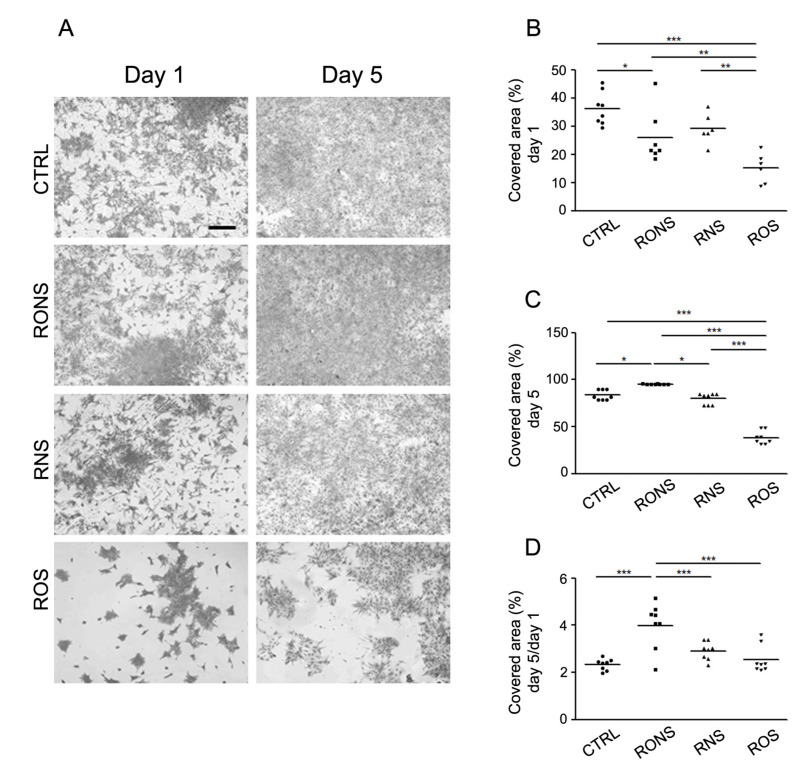
Coomassie blue assay of astrocytes incubated with different PALM. (A) Coomassie blue staining of astrocytes, one and five days after a 2 h-PALM incubation. Images are compared with the untreated medium (Ctrl) used as control. Different PALM are indicated as follows: PALM N2 (RONS), PALM Air (RNS) and PALM O2 (ROS). Scale bar, 500 μm. (B) Scattered plots showing the percentage area covered by cells at day 1. (C) Scattered plots showing the percentage area covered by cells at day 5. (D) Scattered plot measuring the ratio of the area covered by astrocytes after five days over that covered after one day. A One-way Anova and Newman–Keuls Multiple Comparison Test were performed. *: p < 0.05; **: p < 0.01; ***: p < 0.001.

