Figure 1.
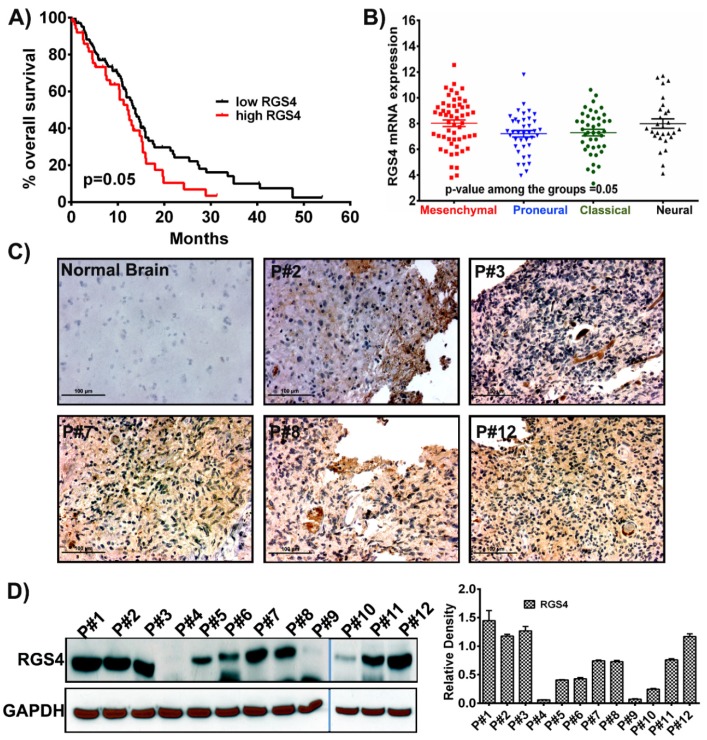
RGS4 expression in glioblastoma samples. (A) Kaplan–Meier curve plotted from the data obtained from The Cancer Genome Atlas (TCGA) shows that increased regulators of G-protein signaling 4 (RGS4) expression corresponds to decreased survival (n = 172). p-value is calculated by log rank test (p = 0.05). (B) The mRNA expression levels of RGS4 plotted in different subtypes of glioblastoma (n = 163; mesenchymal = 42; proneural = 55; classical = 27; neural; = 39). The error bars are plotted based on the standard error of mean (SEM). (C) Immunohistochemical staining for RGS4 with anti-RGS4 antibody (brown, diaminobenzidine; light blue, nuclear counter stain with 4′,6-diamidino-2-phenylindole (DAPI); P = glioblastoma specimen) showed positive staining in the glioblastoma (GBM) patient specimens. Negative staining is observed in the normal brain sample specimen (Bar = 100 µM). (D) Immunoblot analysis of RGS4 expression in different patient samples (human GBM (hGBM) patient samples = 12). GAPDH (Glyceraldehyde 3-phosphate dehydrogenase) is used as a loading control. The density levels were quantified and represented as a bar graph.

