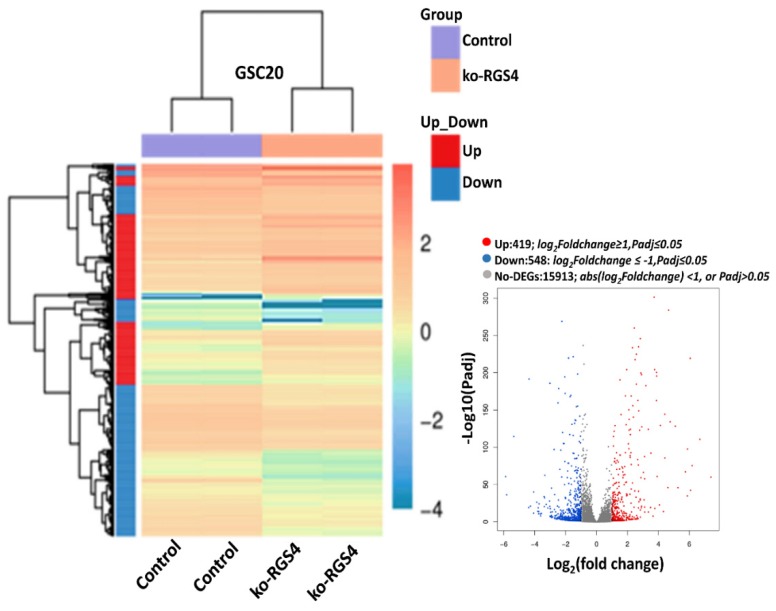
Figure 2.
RNA sequencing analysis. Hierarchical clustering RNA sequencing (RNA-seq) data from untreated control and ko-RGS4-treated glioma cancer stem cell (GSC)20 cells. The gradient legend at the top right of the graph represents the FPKM (fragments per kilobase of exon model per million reads mapped) value that has been logarithmically converted. Each column represents a sample, each row represents a gene, different colors represent different expression levels—red for high expression and blue for low expression. Inlet: Volcano plot of differentially expressed genes (DEGs) (red = highly expressed; blue = highly downregulated; grey = unchanged).

