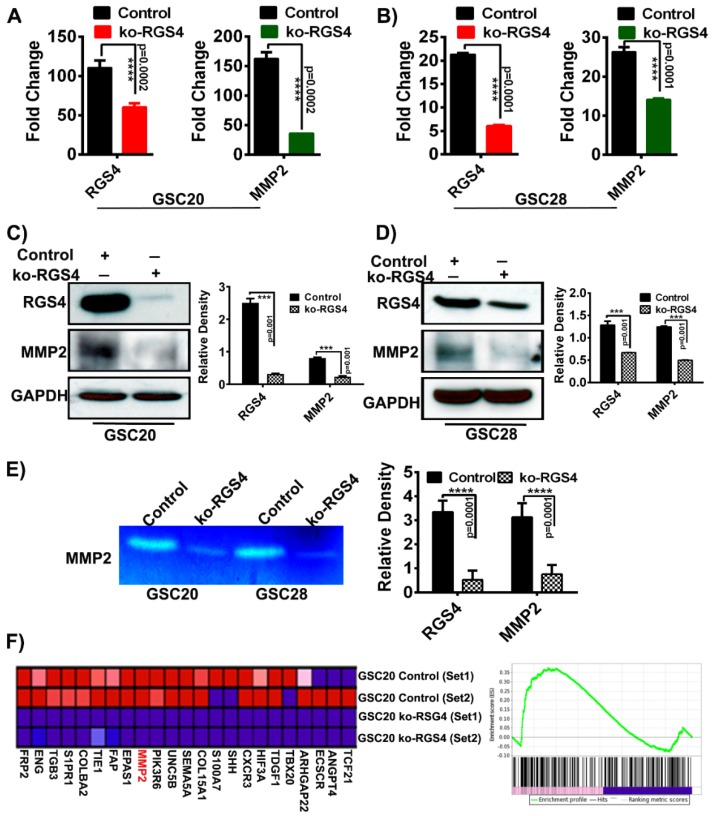
Figure 4.
RGS4 modulate matrix metalloproteinase-2 (MMP2) expression. RT-PCR and immunoblot analysis of RGS4 and MMP2 in GSC20 and GSC28 cells treated with knockout-RGS4 (ko-RGS4) and untreated control cells (A–D) (n = 3) (**** p = 0.0002; **** p = 0.0001; *** p = 0.001). GAPDH was used as a loading control. The density levels were quantified and represented as a bar graph. (E) MMP2 activity was evaluated by gelatin zymography by using conditioned media from control and ko-RGS4-transfected GSC20 and GSC28 cells collected 48 h after transfection. Bar graph represents the densitometry analysis of MMP2 activity. (F) Gene set enrichment analysis (GSEA) using gene set involved in maintaining GSC angiogenesis after ko-RGS4 treatment. The green line demonstrate the enrichment profile. The error bars are plotted based on the SEM (standard error of mean).

