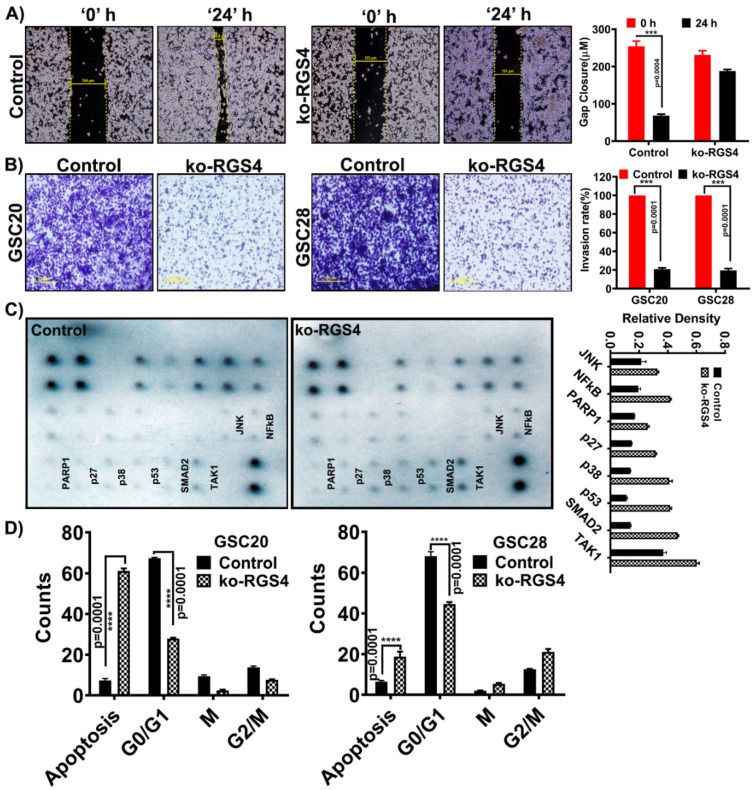
Figure 5.
Functional analysis of targeting RGS4 in GSC. (A) GSC20 cells were cultured on Poly-D-Lysine-coated six-well plate and treated with ko-RGS4. After 48 h of transfection, a straight scratch was made in individual wells. This point was considered 0 h, and the width of wound was photographed under a microscope. After 24 h, cells were checked for wound healing and again photographed under a microscope. Wound closure distances were used to plot the bar graph (p = 0.001, n = 3) (*** p = 0.004). Yellow bar explains the percentage of wound contraction/repair (Bar = 100 µM). (B) Using Matrigel plug invasion assay, ko-RGS4-treated GSC20/GSC28 cells and untreated control cells were plated in a six-well plate. After 24 h, cells penetrating the membrane were fixed and stained with 0.1% crystal violet. The pictograms were captured using an Olympus IX71 microscope. The percent invasion was calculated by taking the untreated control cell invasion as 100% and the treatments were compared against the controls. The data are presented as a bar graph (p = 0.001, n = 3) (*** p = 0.001) (Bar = 100 µM). (C) Using a human apoptosis signaling pathway array (Ray Biotech AAH-APOSIG), we recorded increased expression levels of apoptosis markers such as PARP1, p27, p53, SMAD and TAK1 and other markers in the ko-RGS4-treated cells when compared to the untreated control cells. The band densities were plotted in a bar graph (n = 2). (D) Cell cycle analysis using flow cytometry confirmed increased apoptosis upon ko-RGS4 treatment. Graphical representation of the percentage of cells in each stage of the cell cycle was represented in a bar graph (n = 3) (**** p = 0.0001). The error bars are plotted based on the SEM (standard error of mean).

