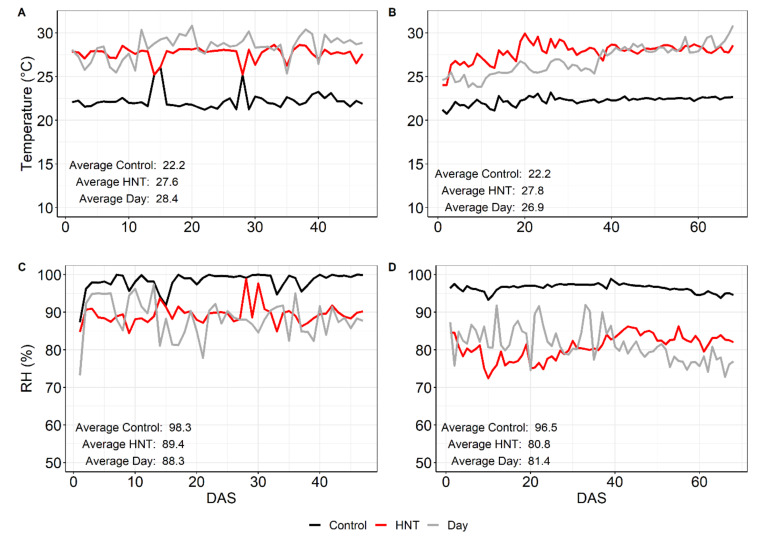
Figure 1.
Average temperature (A,B) and relative humidity (RH) (C,D) during the night (6 p.m.–6 a.m.) in the wet season (WS) (A,C) and dry season (DS) (B,D) under control and HNT conditions, measured till the end of sampling at 50% flowering. For comparison, day temperature and humidity are included (grey lines). Measurements, which were done every 30 min, were averaged. DAS—Days after stress; WS—wet season; DS—dry season.

