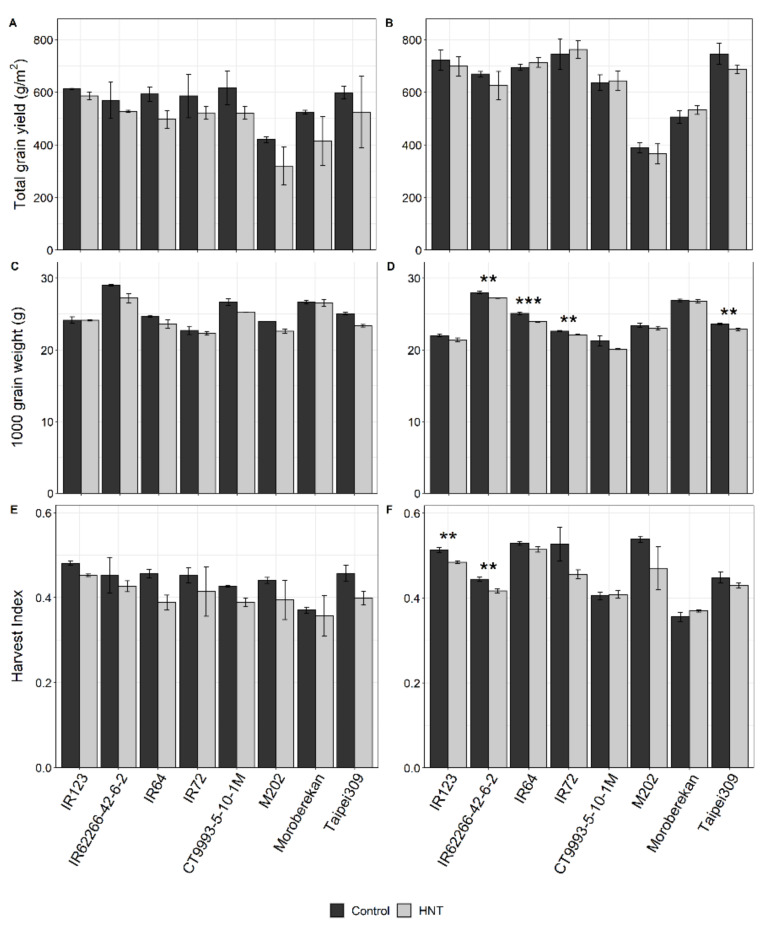
Figure 3.
Grain yield (A,B), 1000-grain weight (C,D) and harvest Index (E,F) of eight rice cultivars under control and HNT conditions in the WS (A,C,E) and DS (B,D,F). For the WS, bars represent the means and error bars, the range of two replicates generated from 12 plants, each. For the DS, the bars represent the means ± SEM of five replicates generated from 12 plants, each. Cultivars are sorted alphabetically within the respective O. sativa subspecies indica (1–4) and japonica (5–8). Significance levels were only calculated for the DS due to an insufficient replicate number in the WS and are indicated by asterisks: 0.001 < ***; 0.001 > ** < 0.01; 0.01 > * < 0.05.

