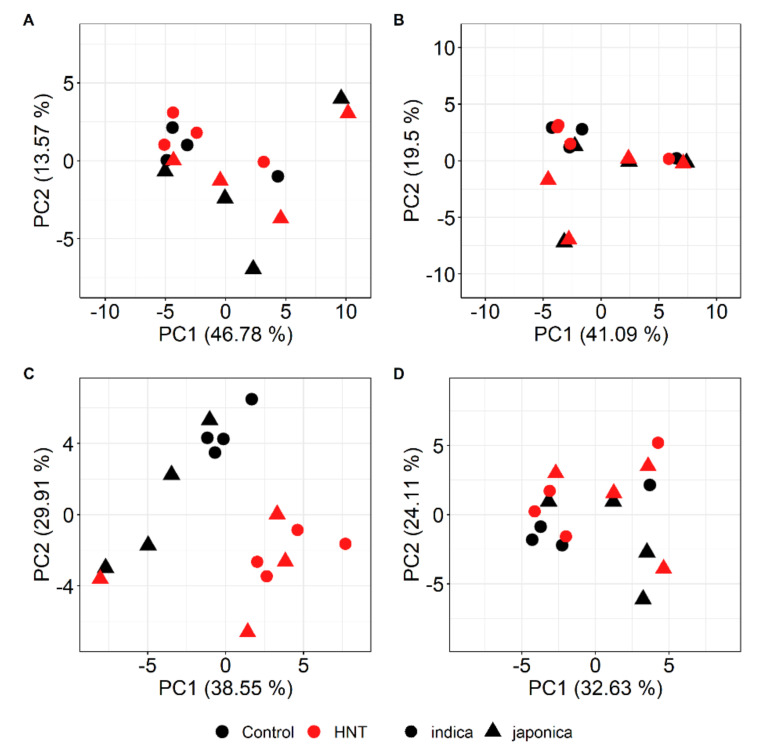
Figure 4.
Score plots of the first two Principal Components (PC1 and PC2) from the Principal Component Analysis (PCA) of the metabolite profiles of rice flag leaves (A, B) and panicles (C, D) of the eight investigated rice cultivars under control and HNT conditions in the WS (A, C) and DS (B, D). For flag leaves, means of the median-normalized and log2-transformed mass spectral intensities of 76 metabolites, and for panicles, those of 69 metabolites, were used. Numbers in parentheses indicate the fractions of the total variance explained by the respective PCs.

