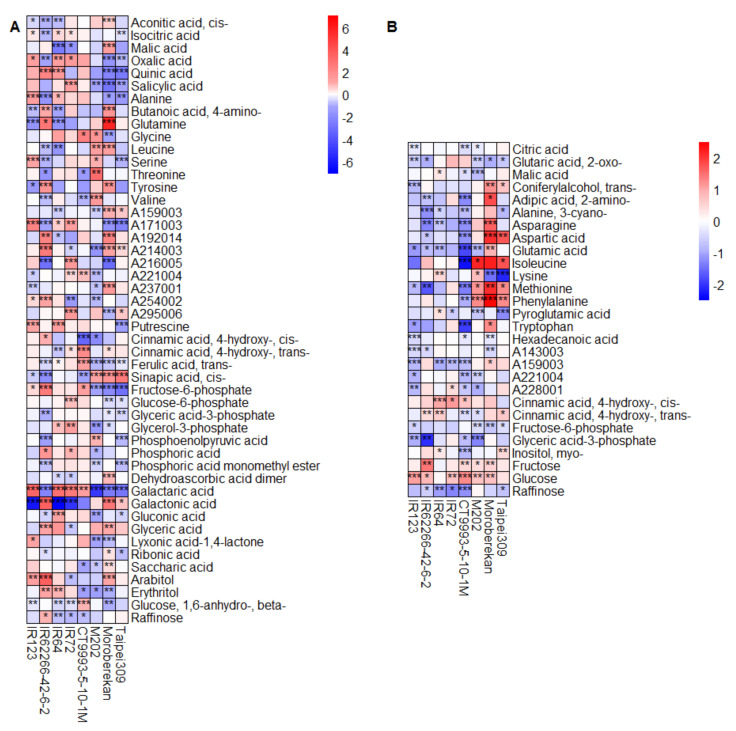
Figure 5.
Heat maps showing the log2 fold changes in metabolite levels under control conditions in the DS compared to the WS for flag leaves (A) and panicles (B). Only metabolites with a significant change in at least three out of the eight cultivars are displayed. The level of significance is indicated by asterisks (* p < 0.05; ** p < 0.01; *** p < 0.001) and the log2 fold change is represented by the indicated color code. Blue indicates a lower metabolite level in the DS compared to the WS, and red, a higher level. Metabolites are listed alphabetically within the metabolite classes (compare Supplementary Table S2). Cultivars are sorted alphabetically within the respective O. sativa subspecies indica (1–4) and japonica (5–8).

