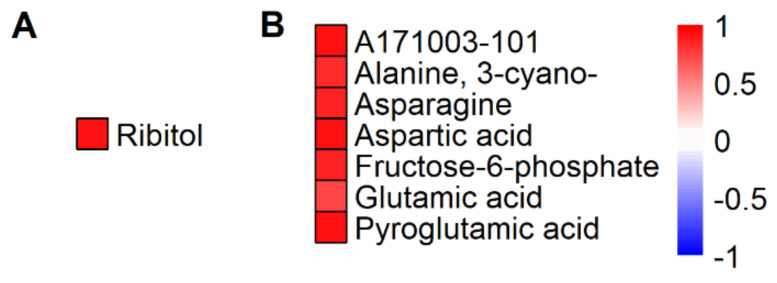
Figure 9.
Metabolites with significant correlations (Spearman’s rank correlation, p < 0.05) between total grain yield reduction under HNT in the WS and the corresponding changes in metabolite contents (log2 fold change) in flag leaves (A) and in panicles (B). Red color indicates positive correlations. Metabolites are sorted alphabetically.

