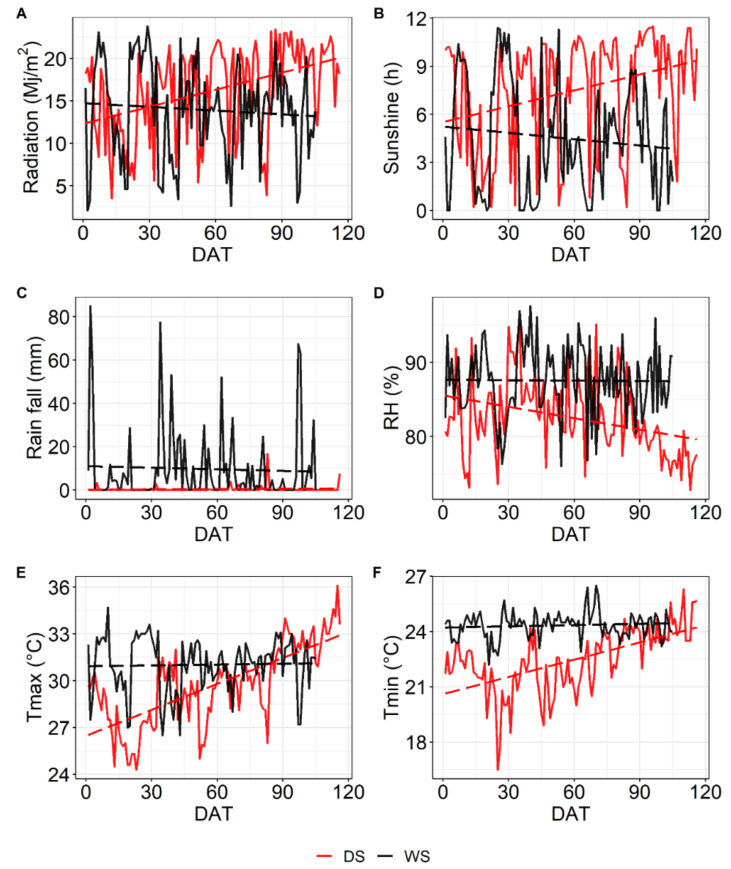
Figure A2.
Weather data for the DS and WS experiment measured at the IRRI weather station as average values per day. Radiation (A), sunshine duration (B), rainfall (C), relative humidity (D), maximal temperature Tmax (E), minimal temperature Tmin (F). Broken lines represent a trend line for the respective data set. DAT—days after transplanting. Average values for all weather parameters were significantly different (p < 0.05) between WS and DS.

