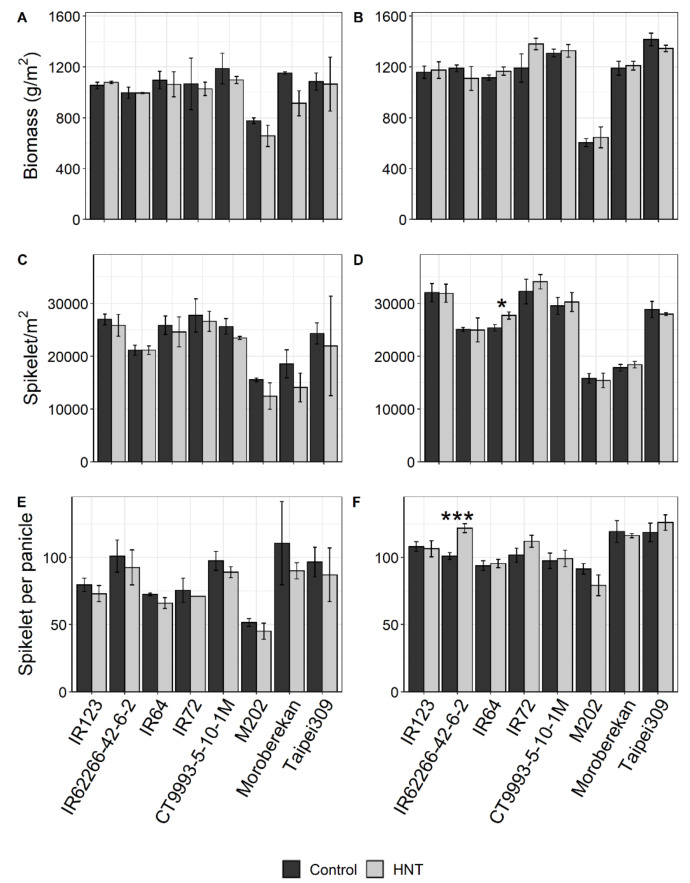
Figure A4.
Biomass (A, B), spikelets per m2 (C, D), and spikelets per panicle (E, F) of eight rice cultivars in response to HNT stress for the WS (A, C, E) and DS (B, D, F). For the WS, variance is displayed as range between means of two replicates with 12 plants each; for the DS, the standard error of the mean of five replicates with 12 plants each is shown. Cultivars are sorted alphabetically within the respective O. sativa subspecies indica (1-4) and japonica (5–8). Significance levels were only calculated for the DS due to the insufficient replicate number in the WS and are indicated by asterisks: 0.001 < ***; 0.001 > ** < 0.01; 0.01 > * < 0.05.

