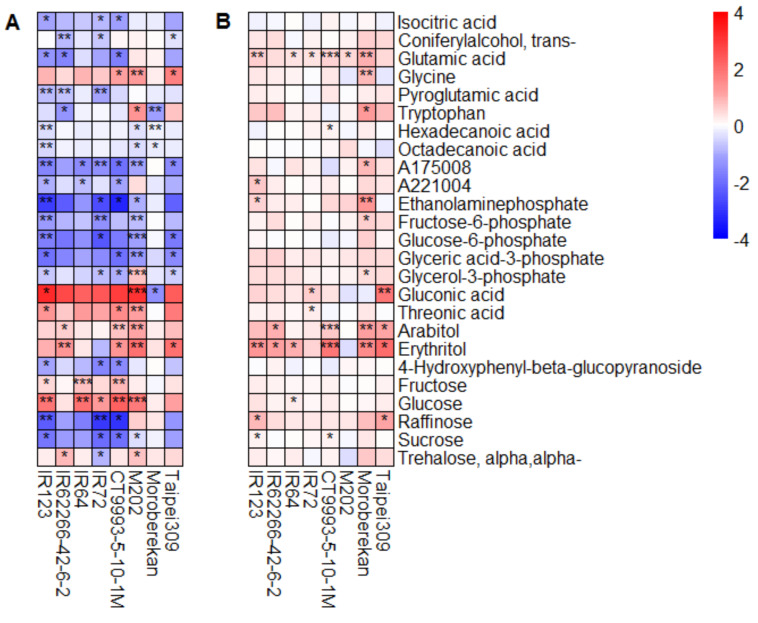
Figure A6.
Log2 fold changes in significantly changed metabolite pools under HNT compared to under control conditions in panicles for the WS (A). For comparison, the same metabolites are shown for the DS (B) independent of a significant change. For the WS (A), only metabolites that showed a significant change in at least three out of eight cultivars are displayed. The level of significance is indicated by asterisks (* p < 0.05; ** p < 0.01; *** p < 0.001), and the log2 fold difference is indicated by the color code. Blue indicates a lower metabolite level compared to under the control condition, and red, a higher level. Cultivars were sorted alphabetically within the respective O. sativa subspecies indica (1–4) and japonica (5–8).

