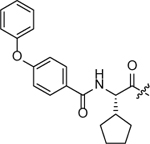
Table 1.
IC50 values for off-DNA ligands in a ligand displacement fluorescence polarization assay. (A) Ligands containing trimethyllysine (B) Ligands containing diethyllysine. IC50 values for each ligand against CBX6, CBX7, and CBX8 ChDs, were measured using 100 nM fluorescent probe and 1 µM CBX6, 0.4 µM CBX7, 4 µM CBX8 ChDs. Reported values are the average of quadruplicates ± s.d. NB: No binding observed. ND: Value not determined. In some cases, full curves could not be determined due to IC50’s >100 μM or compound aggregation (Aggreg.). Full binding curves are shown in SI 6 and SI 4.
 |
IC50 (µM) | |||
|---|---|---|---|---|
| Compound | R = | CBX6 | CBX7 | CBX8 |
| KED98 (Parental) |
 |
34 ± 1 | 83 ± 2 | 14 ± 1 |
| SW2_90 (PSL2A_52) |
 |
0.36 ± 0.05 | 0.8 ± 0.1 | 2.1 ± 0.5 |
| SW2_101E (PSL2A_57) |
 |
4.8 ± 0.6 | 83 ± 1 | 3.1 ± 0.8 |
| SW2_49B (PSL2A_75) |
 |
ND | ND (> 100) |
44 ± 8 |
| SW2_101B (PSL2B_48) |
 |
NB | ND (> 100) |
12 ± 1 |
| SW2_89 (PSL2B_42) |
 |
ND (Aggreg.) |
22 ± 1 | 13 ± 1 |
| SW2_101F |  |
ND (> 100) |
1.6 ± 0.3 | 4.0 ± 1 |
| SW2_101A |  |
98 ± 26 | 35 ± 9 | 40 ± 8 |
 |
IC50 (µM) | |||
|---|---|---|---|---|
| Compound | R = | CBX6 | CBX7 | CBX8 |
| SW2_110A |  |
ND (Aggreg.) |
ND (Aggreg.) |
>7.0 (Aggreg.) |
| SW2_104B |  |
ND (Aggreg.) |
ND (Aggreg.) |
>15 (Aggreg.) |
| SW2_110B |  |
ND (Aggreg.) |
ND (Aggreg.) |
>5.7 (Aggreg.) |
| SW2_104A |  |
2.7 ± 0.7 | 4.8 ± 0.9 | 1.6 ± 0.6 |
