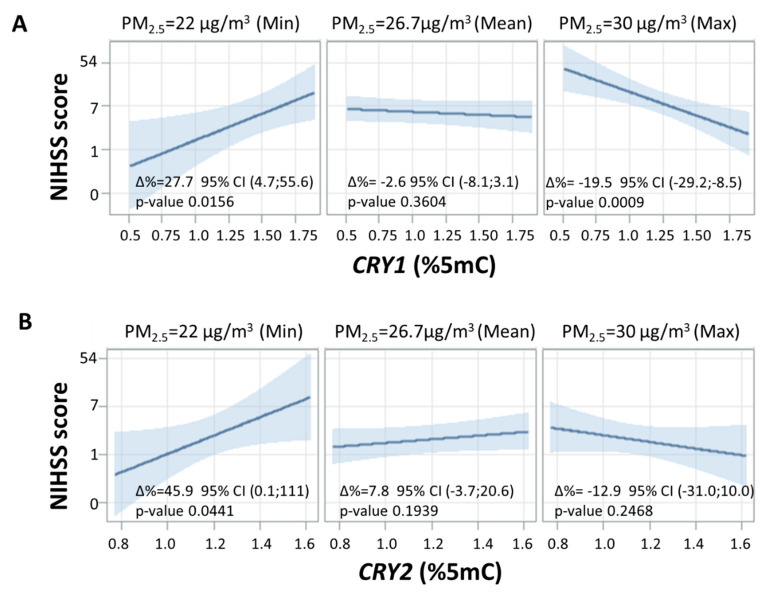
Figure 2.
Interaction effect of PM2.5 annual average and clock gene methylation on NIHSS score. Strength of association between clock gene methylation and NIHSS score on natural logarithmic scale at three selected levels of annual average PM2.5 (min, mean, and max). Panels (A,B) represent CRY1 and CRY2, respectively. For all panels, ∆% is equal to (exp(β/10)–1) × 100 and represents the percentage increase in NIHSS score for 0.15mC% increase in CRY1/CRY2 methylation at each concentration of annual average PM2.5. Linear regression models were adjusted for age, sex, smoking habits, diabetes, hypertension, plate, and warm/cold months (months with heaters switched on/off).

