Figure 3.
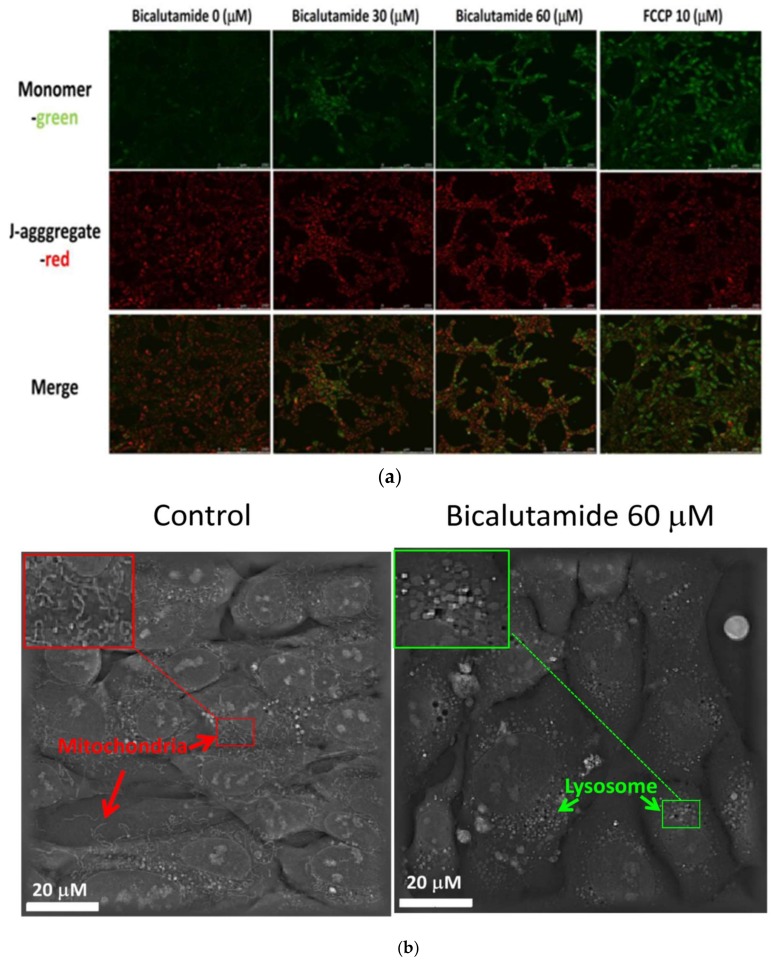
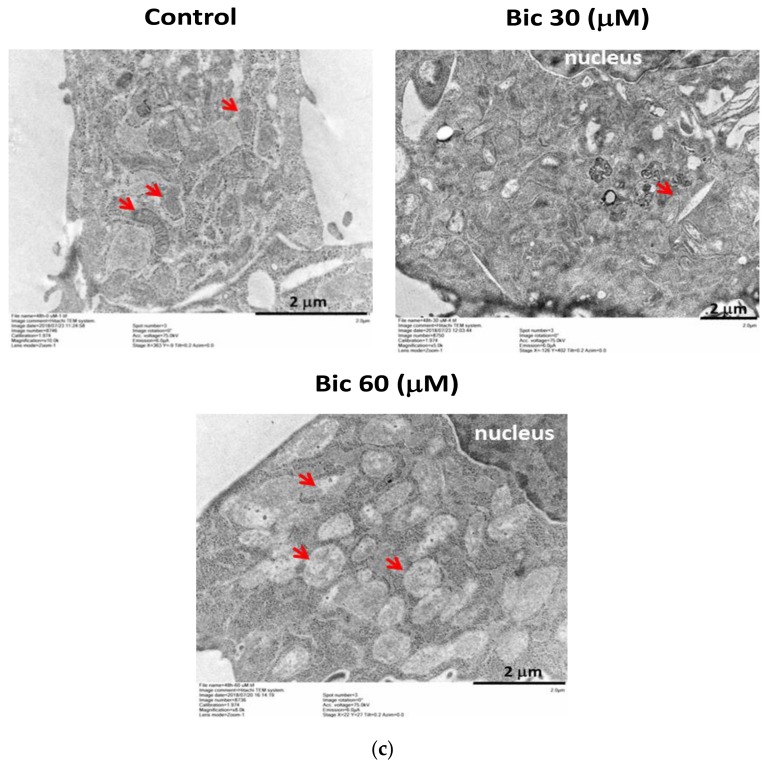
Estimation of the mitochondrial membrane potential and morphological changes. (a) Cells were treated with bicalutamide (Bic) at 30 and 60 μM for 24 h. JC-1 staining showed changes in the mitochondrial potential affected by Bic therapy. Scale bar = 250 μM (b) Living cell tomographic microscopy of rat mesangial cells (RMCs) affected by Bic (60 μM) at 48 h as viewed with Nanolive 3D cell explorer (microscale length: 20 μm, magnification: × 400). Control images revealed mitochondria containing many fibrous structures (indicated by a red arrow, also see enlarged insert), which were less seen in Bic (60 μM)-treated cells and clusters of lysosomes instead appeared in treated cells (indicated by a green arrow, also see enlarged insert). (c) Morphological changes in mitochondria after being treated with Bic at 30 and 60 μM for 48 h. As seen, the mitochondria treated with 30 μM Bic were only slightly swollen, while those treated with 60 μM were severely swollen ( red arrow: mitochondria). Scale bar = 2 μm.


