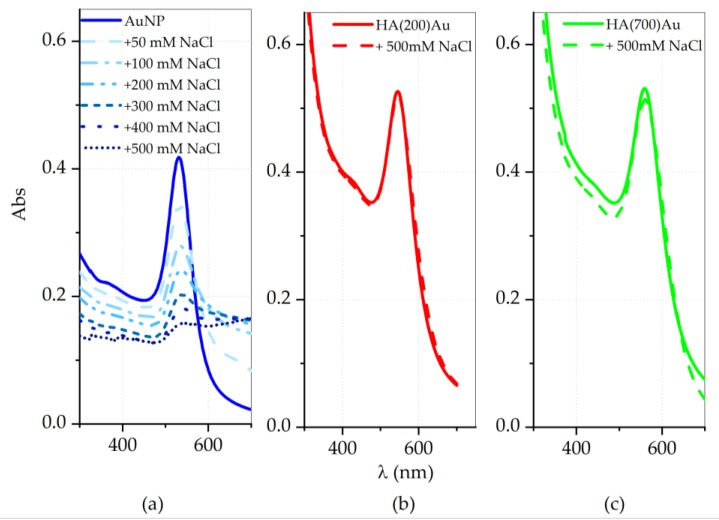
Figure 5.
UV-visible spectra of bare AuNP (a) before (solid line) and after (dashed lines) the gradual addition of NaCl aqueous solution at increasing concentrations from 0.05 M to 0.5 M. The UV-visible spectra before (solid line) and after (dashed lines) the direct addition of 0.5 M NaCl are shown in (b) for HA(200)Au (0.11 nM = 4 × 10³ AuNP/mL) and in (c) for HA(700)Au (0.06 nM = 6 × 10² AuNP/mL).

