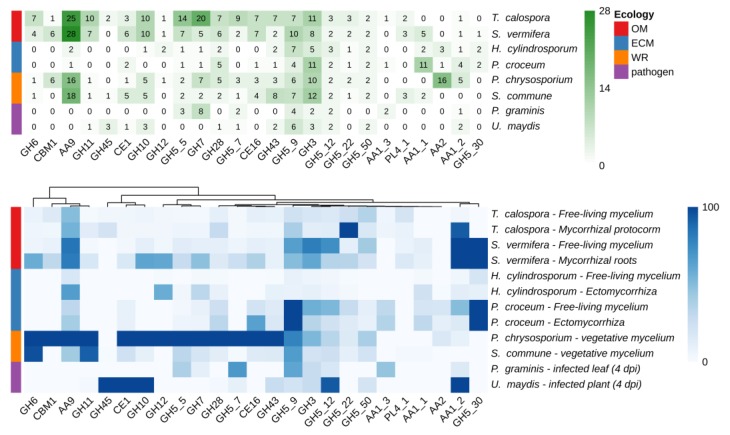
Figure 3.
Number of CAZymes encoding-genes annotated in a number of Basidiomycota genomes (upper panel) and heatmap of expression levels across different tissues and conditions (bottom panel). Expression values are reported in TPM (transcripts per million) and columns are clustered by using Euclidean distances. Fungal species with different lifestyles were considered: orchid mycorrhizal (OM), ecto-mycorrhizal (ECM), white rot (WR), plant pathogens.

