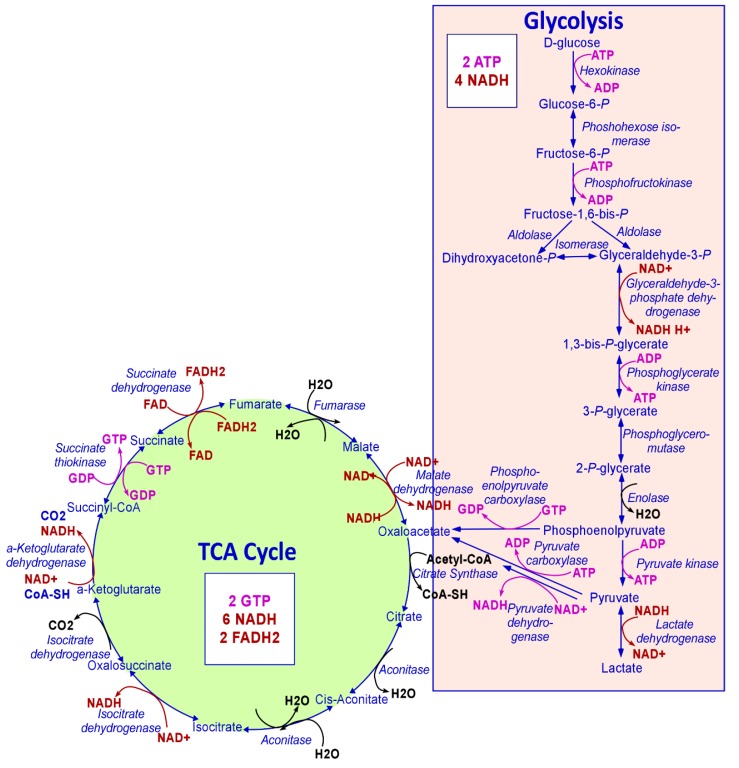
Figure 1.
The metabolic steps of glycolysis and TCA cycle. Every step of glycolysis and the TCA cycle are shown. The NAD+/NADH and FAD/FADH2 generated or utilized are shown in red. The ATP/GTP synthesized and consumed is shown in pink. The numbers of ATP, GTP, NADH, and FADH2 generated when one molecule of glucose is consumed following glycolysis, and the TCA cycle are also shown.

