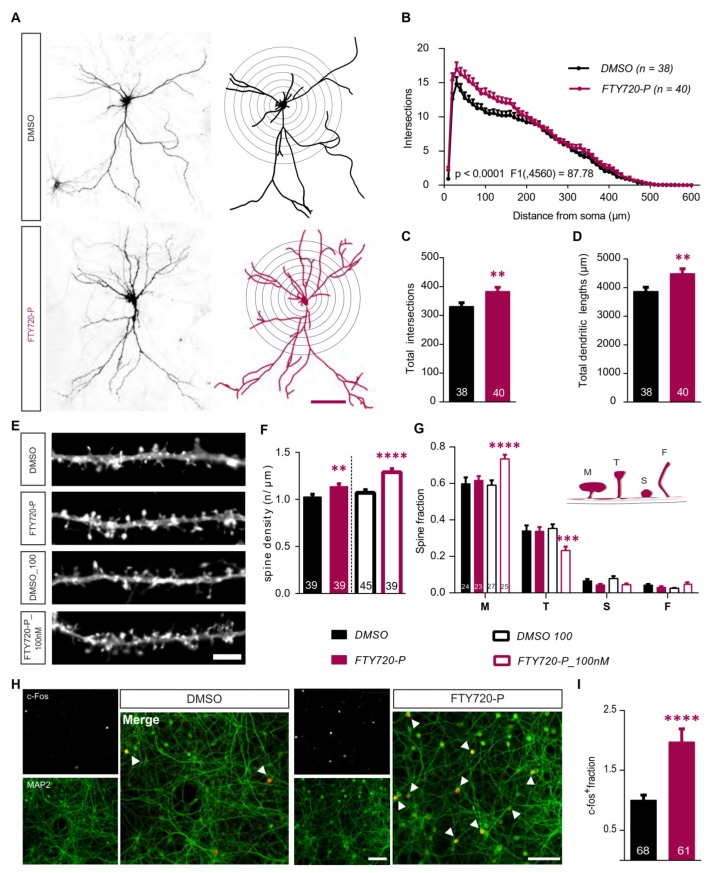
Figure 1.
Fingolimod-phosphate (FTY720-P) modulates neuronal morphology in mature hippocampal neurons. FeGFP expressing 21DIV primary hippocampal neurons from healthy wild type BL/6J mice were treated with 10nM FTY720-P for 24h. (A) Representative images (left) of feGFP expressing neurons treated with DMSO (above, black) and 10nM FTY720-P (below, magenta) and the relative Neurolucida tracing used to perform the Sholl analysis (right). Scale bar: 100μm. (B) Sholl analysis displaying dendritic complexity plotted against distance from the cell soma. F value refers to the DMSO v/s FTY720-P comparison. The graphs show (C) the total dendritic complexity and (D) total lengths of dendrites for the DMSO (black) and FTY720-P (magenta) treated neurons. (E) Representative segments of secondary dendrites from feGFP transfected neurons used to analyze dendritic spine density. Scale bar: 5μm (F) Graphical representation of the spine density for neurons treated with 10 (magenta solid) or 100nM (magenta open) FTY720-P their respective DMSO controls (10nM black solid; 100nM black open). (G) the graph shows the distribution of different dendritic spine types across all treatment groups. The four different types of spines– mushroom (M), thin (T), stubby (S) and filopodia (F) as represented in the schematic, were quantified and represented as a fraction of total spines for neurons treated with FYT720P (10nM magenta solid; 100nM magenta open) or DMSO (10nM black solid; 100nM black open). (H) Images of fields of view (FOV) of DMSO (left) and FTY720-P (right) treated primary hippocampal cultures immunostained for c-Fos (inset: above) and MAP2 (inset: below) with their respective merged images (right). The arrows indicate c-Fos expressing MAP2 positive neurons in the merged picture. Scale bar: 100μm. (I) Graph comparing the normalized number of c-Fos+ cells over total MAP2+ neurons between DMSO (black) and FTY720-P (magenta) treated cultures. All plots represent data as mean + SEM. Numbers in the bars indicate total number of neurons or of FOV analyzed, obtained from ≥3 sets of independent experiments. Two-way ANOVA followed by Bonferroni post-hoc test was used in (B) and (G). For (C,D) and (I) unpaired Student’s t-test and for (F), one-way ANOVA with Bonferroni post-hoc was used. Significance is denoted as ** p < 0.01, *** p < 0.001, **** p < 0.0001.

