Figure 3.
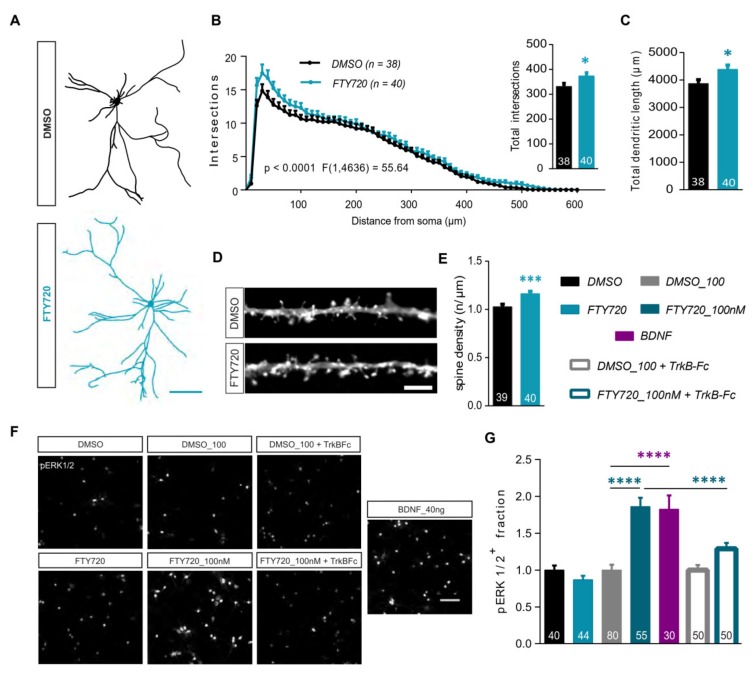
Treatment with the non-phosphorylated Fingolimod (FTY720) modulates neuronal architecture. (A)| Representative Neurolucida tracings from feGFP positive hippocampal neurons used for the Sholl analysis from cultures treated either with DMSO or 10nM FTY20 for 24 h. Scale bar: 100μm. (B)| Dendritic complexity shown by the number of dendritic intersections plotted against the distance from the soma for DMSO (black) and FTY720 (blue) treated neurons. The F value shows the statistical comparison between the two groups. The inset graph represents total dendritic complexity upon treatment with DMSO (black) and FTY720 (blue). (C)| Total dendritic length for DMSO (black) and FTY720 (blue) treated neurons. (D)| Representative stretches from dendrites of eGFP transfected hippocampal neurons showing dendritic spine protrusions, treated either with DMSO or FTY720 for 24h. Scale bar: 5μm. (E)| The graph shows dendritic spine density for DMSO (black) and FTY720 (blue) treated neurons. (F)| Representative images of fields of view (FOV) from primary hippocampal cultures stained with anti phospho-ERK1/2 antibody, 30 min post-application of one of the following: DMSO, 10nM FTY720, DMSO_100, 100nM FTY720, DMSO_100 + TrkB-Fc, 100nM FTY720 + TrkB-Fc or 40ng recombinant BDNF protein as a positive control. Scale bar: 100μm. (G)| The graph displays the fraction of pERK1/2 expressing neurons relative to the total number of MAP2+ neurons. The data is normalized to the respective controls and compared between the different treatment groups: DMSO (black), 10nM FTY720 (light blue solid), DMSO100 (gray), 100nM FTY720 (dark blue solid), 40ng recombinant BDNF (magenta), DMSO100 + TrkB-Fc (gray open), 100nM FTY720 + TrkB-Fc (dark blue open). All data is plotted as mean + SEM. Numbers in the bars show total number of neurons or FOV analyzed, obtained from ≥3 sets of independent experiments. Two-way ANOVA followed by Bonferroni post-hoc test was used in (B). For (B) total intersections, (C) and (E) unpaired Student’s t-test and for (G) one-way ANOVA with Bonferroni post-hoc was used. Denotations for significance are * p < 0.05, *** p < 0.001, **** p < 0.0001.

