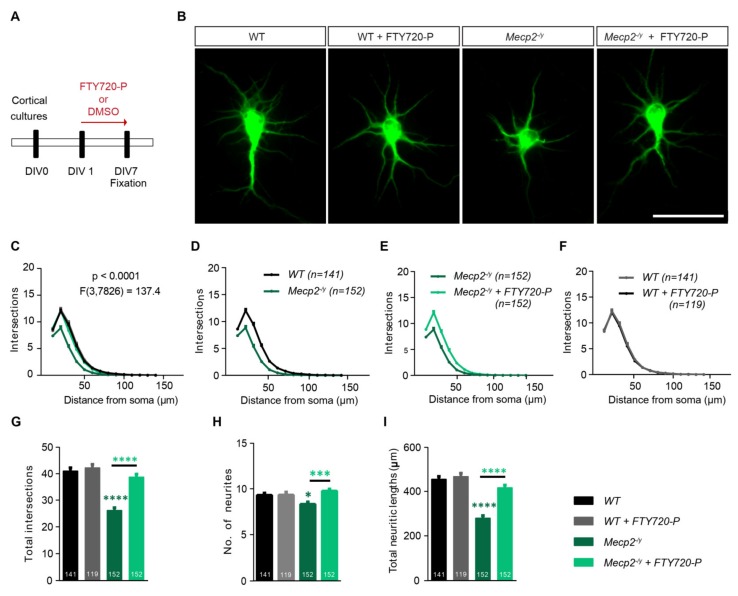
Figure 4.
Fingolimod-phosphate (FTY720-P) completely rescues the neuronal architecture in developing Mecp-/y cortical neurons. Young DIV7 cortical cultures from Mecp2-/y mice or littermate wild type (WT) controls were allowed to develop for one week with either DMSO alone or with 10nM FTY720-P in the growth medium. (A) The diagram shows the scheme of treatment from culture preparation on DIV0, treatment from DIV1 to fixation on DIV7. (B) Micrographs showing representative fluorescent images of DIV7 WT and Mecp2-/y cortical neurons stained for MAP2 and treated with either DMSO or FTY720-P. Scale bar: 50 μm. Neurite complexity plotted as number of neurite intersections against the distance from the soma for: (C) all four test groups- WT (black), WT neurons treated with 10nM FTY720-P (gray), Mecp2-/y (dark green) and Mecp2-/y neurons treated with 10nM FTY720-P (light green). F value for comparison between all sets is described with the graph. For better visualization of differences between different pairs, Sholl curves are also plotted separately: (D) WT (black) and Mecp2-/y (dark green) neurons (E) Mecp2-/y neurons treated with 10nM FTY720-P (light green) v/s DMSO controls (dark green) and (F) WT neurons treated with 10nM FTY720-P (gray) v/s DMSO controls (black). (G) Total intersections, (H) number of neurites and (I) total length of neurites as computed for WT neurons treated with DMSO (black) or FTY720-P (gray) and Mecp2-/y treated with DMSO (dark green) or FTY720-P (light green). Data in graphs is plotted as mean + SEM. Numbers in the bars show total number of neurons analyzed for each genotype and treatment, obtained from ≥3 sets of independent experiments. Two-way ANOVA followed by Bonferroni post-hoc test was used in A. For G,H and I one-way ANOVA with Bonferroni post-hoc was used. Denotations for significance are *** p < 0.001, **** p < 0.0001.

